Best End-to-end monitoring tools are unified platforms that track every step of a user journey and the systems behind it combining synthetic tests, real user monitoring (RUM), APM, logs, metrics, and traces.
They help DevOps/SRE teams detect, diagnose, and fix issues fast, protect SLAs/SLOs, and continuously improve digital experience. If your stack spans browsers, APIs, microservices, databases, and clouds, end-to-end monitoring tools provide the single source of truth you need.
This guide ranks the 11 best end-to-end monitoring tools in 2026, explains how to choose the right fit, and shows how to set up a real, production grade approach that scales.
What is End-to-End Monitoring?
End-to-end monitoring follows live or synthetic user journeys from the frontend to the backend and infrastructure layers.
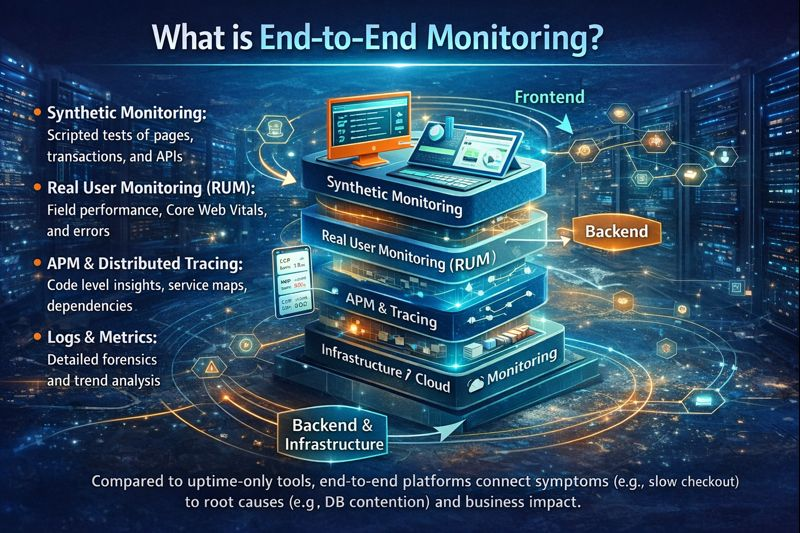
A complete stack combines
- Synthetic monitoring: scripted tests of pages, transactions, and APIs from multiple regions.
- Real User Monitoring (RUM): real time performance, Core Web Vitals, and errors for actual users.
- APM and distributed tracing: code level insights, service maps, dependencies, and latency.
- Logs and metrics: detailed forensics and trend analysis.
- Infrastructure/Cloud monitoring: hosts, containers, Kubernetes, databases, serverless.
Compared to uptime only tools, end-to-end platforms connect symptoms (e.g., slow checkout) to root causes (e.g., DB contention, cold start, or a failing dependency) and business impact.
How to Choose the Best End-to-End Monitoring Tool in 2026?
- Coverage: Synthetic, RUM, APM, logs, metrics, tracing, and infra/Kubernetes.
- OpenTelemetry support: vendor neutral instrumentation for future proofing.
- Root cause speed: AI/ML assisted correlation, topology maps, and noise reduction.
- Dashboards and SLOs: easy to create, business friendly, and shareable.
- Alerting and on call: flexible routing, deduplication, and escalation policies.
- Scalability and cost: transparent pricing, data retention, and sampling controls.
- Ecosystem: integrations with CI/CD, cloud, incident management, and collaboration tools.
- Compliance and security: data residency, RBAC, SSO, and audit trails.
11 Best End-to-End Monitoring Tools in 2026
1. Datadog
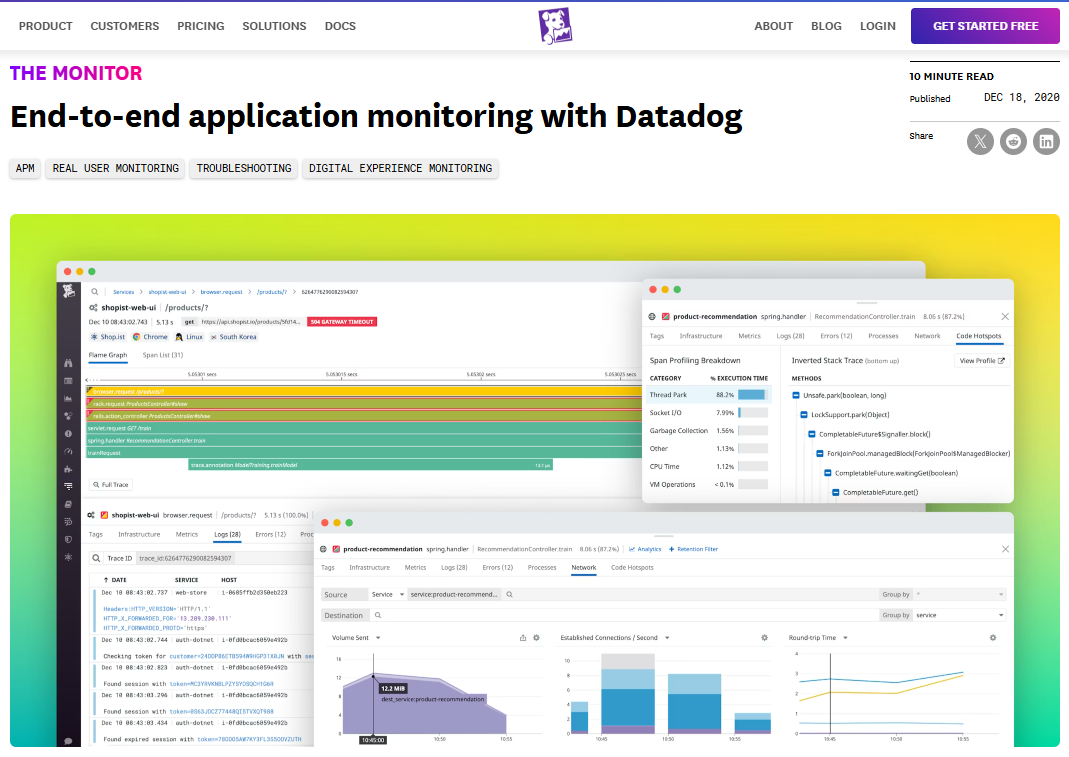
When slow applications, unexpected errors, or unclear system behavior start affecting user experience and productivity, Datadog steps in to provide clarity. It’s a unified full stack observability platform covering RUM, synthetic testing, APM, logs, infrastructure, and security.
By monitoring every layer from frontend interactions to backend services, APIs, microservices, and cloud infrastructure it links all data for fast root cause analysis.
Visual dashboards, anomaly detection, and flexible alerts empower teams to fix issues quickly, optimize performance, and maintain smooth, reliable, and responsive digital operations at cloud native scale.
- Best for: Fast growing teams, cloud native apps, and enterprises.
- Highlights: Service maps, Watchdog AIOps, CI visibility, Kubernetes monitoring, SLOs.
- Pros: Deep integrations, excellent UX, robust alerting.
- Cons: Pricing can climb as data and features expand.
2. Dynatrace
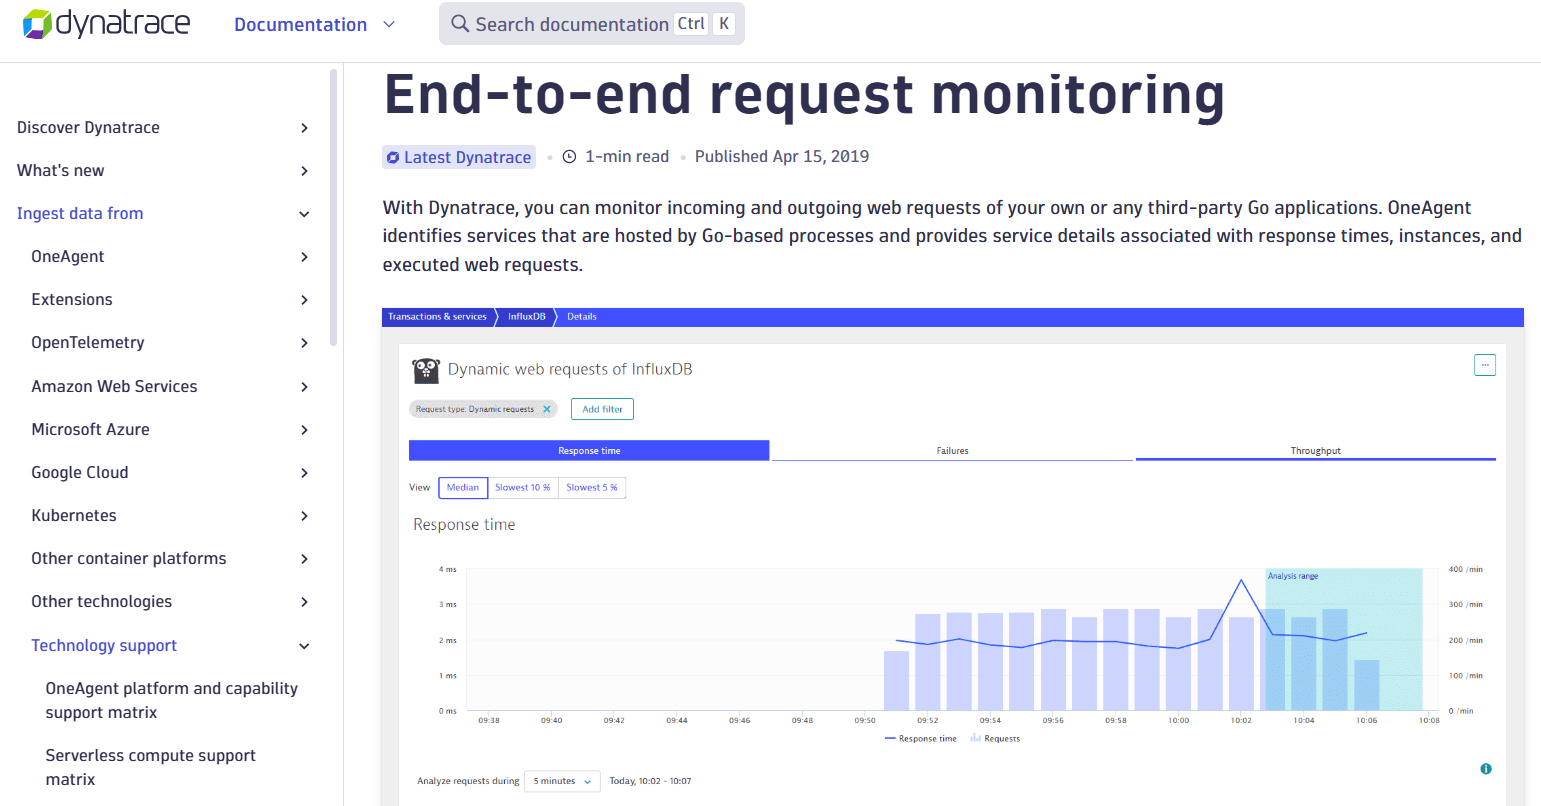
Slow applications, hidden errors, and unclear system behavior can quietly disrupt user experience and business operations. Dynatrace solves this with AI powered end-to-end monitoring that automatically discovers every component, maps dependencies, and pinpoints root causes with Davis AI.
By connecting frontend, backend, microservices, and infrastructure data, it reduces alert noise while highlighting critical issues. Smart dashboards, anomaly detection, and automated insights allow teams to quickly fix bottlenecks, optimize performance, and keep digital experiences seamless, reliable, and responsive across complex cloud native environments.
- Best for: Enterprises needing deterministic root cause and auto instrumentation.
- Highlights: Smartscape topology, Grail data lakehouse, Kubernetes deep dive.
- Pros: Strong automation, precise causation analysis.
- Cons: Enterprise focus; cost and complexity may be high for small teams.
3. New Relic
When digital experiences slow down or unexpected errors disrupt workflows, teams need clear visibility into every layer of their systems. New Relic stands out as the best end-to-end monitoring tool, unifying APM, real user monitoring (RUM), synthetics, logs, metrics, and traces in a single platform.
Its intuitive dashboards and flexible queries make it easy to spot bottlenecks, track performance trends, and correlate frontend interactions with backend processes.
By providing actionable insights across the full stack, New Relic empowers teams to optimize applications, ensure smooth user experiences, and maintain reliable, high-performing digital services without guesswork.
- Best for: Engineering teams seeking a single UI across the stack.
- Highlights: NRQL queries, distributed tracing, browser/mobile monitoring.
- Pros: Powerful analytics, generous free tier tiers historically.
- Cons: Usage based pricing needs careful governance to control spend.
4. Grafana Cloud

When monitoring multiple systems feels complex and scattered, Grafana Cloud simplifies observability by unifying metrics, logs, traces, and synthetic tests in one managed platform.
Built on open standards like Prometheus, Loki, Tempo, and k6, it offers clear visualizations and dashboards that help teams spot issues, analyze trends, and correlate data across the stack.
Grafana Cloud makes it easy to maintain reliable performance, optimize workflows, and gain actionable insights without managing infrastructure manually.
- Best for: Teams standardizing on OSS and OpenTelemetry with a managed backend.
- Highlights: k6 synthetic checks, prebuilt dashboards, SLOs, alerting.
- Pros: Open and flexible, great dashboards, strong cost control options.
- Cons: Some enterprise features require paid tiers; setup still needs expertise.
5. Splunk Observability Cloud
Complex systems generate massive data, making it challenging to track performance and identify issues. Splunk Observability Cloud tackles this by unifying metrics, logs, and traces with powerful analytics, giving teams a clear, end-to-end view of their environment.
Designed for high throughput and security conscious setups, it helps quickly detect anomalies, understand root causes, and maintain reliable operations. With flexible dashboards, alerting, and AI driven insights, Splunk empowers teams to optimize performance, reduce downtime, and ensure smooth, scalable digital experiences.
- Best for: Enterprises with complex data needs and Splunk SIEM synergy.
- Highlights: No sample tracing options, strong log analytics, AI driven insights.
- Pros: Scale and depth; strong forensics and correlation.
- Cons: Cost and complexity may be heavy for smaller orgs.
6. Elastic Observability
Monitoring complex applications can get messy without clear insights. Elastic Observability simplifies this by combining APM, logs, metrics, and synthetic monitoring on the powerful Elasticsearch platform.
Its flexible architecture allows teams to analyze, visualize, and correlate data efficiently, while cost efficient index lifecycle management keeps storage under control.
With customizable dashboards, alerting, and machine learning detection, Elastic Observability helps teams pinpoint performance issues, optimize operations, and maintain smooth, reliable systems across web, mobile, and cloud environments.
- Best for: Teams that already use Elastic Stack and want an integrated solution.
- Highlights: Uptime/synthetics, RUM, APM agents, machine learning detection.
- Pros: Powerful search, self managed or cloud options.
- Cons: Requires tuning to control storage and costs at scale.
7. Cisco AppDynamics

Slow or failing transactions can directly impact revenue and user experience. Cisco AppDynamics, the best end-to-end monitoring tool for business critical applications, provides deep visibility into every transaction, from frontend interactions to backend services.
It maps revenue sensitive flows, tracks performance in real time, and highlights bottlenecks, helping teams optimize operations, ensure smooth experiences, and maintain consistent business outcomes across complex application environments.
- Best for: Enterprises needing business transaction APM and strong governance.
- Highlights: Business iQ, end user monitoring, hybrid visibility.
- Pros: Excellent for app owners and executives tracking outcomes.
- Cons: Licensing and deployment complexity can be higher.
8. Sentry
Unclear errors, slow responses, and hidden regressions can slow development and affect users. Sentry, a developer first solution, tracks frontend and backend errors, monitors performance, and provides detailed release health insights.
By connecting issues to specific commits and offering session replays, it helps teams quickly identify and fix problems. As a result, developers can maintain smoother applications, reduce user impacting errors, and continuously improve performance with clear, actionable data in a single, intuitive platform.
- Best for: Product teams optimizing UX and fixing regressions quickly.
- Highlights: Frontend error tracking, session replays, performance.
- Pros: Great for dev workflows; actionable issue grouping.
- Cons: Not a full infra stack; pair with metrics/infra monitoring for E2E.
9. Checkly
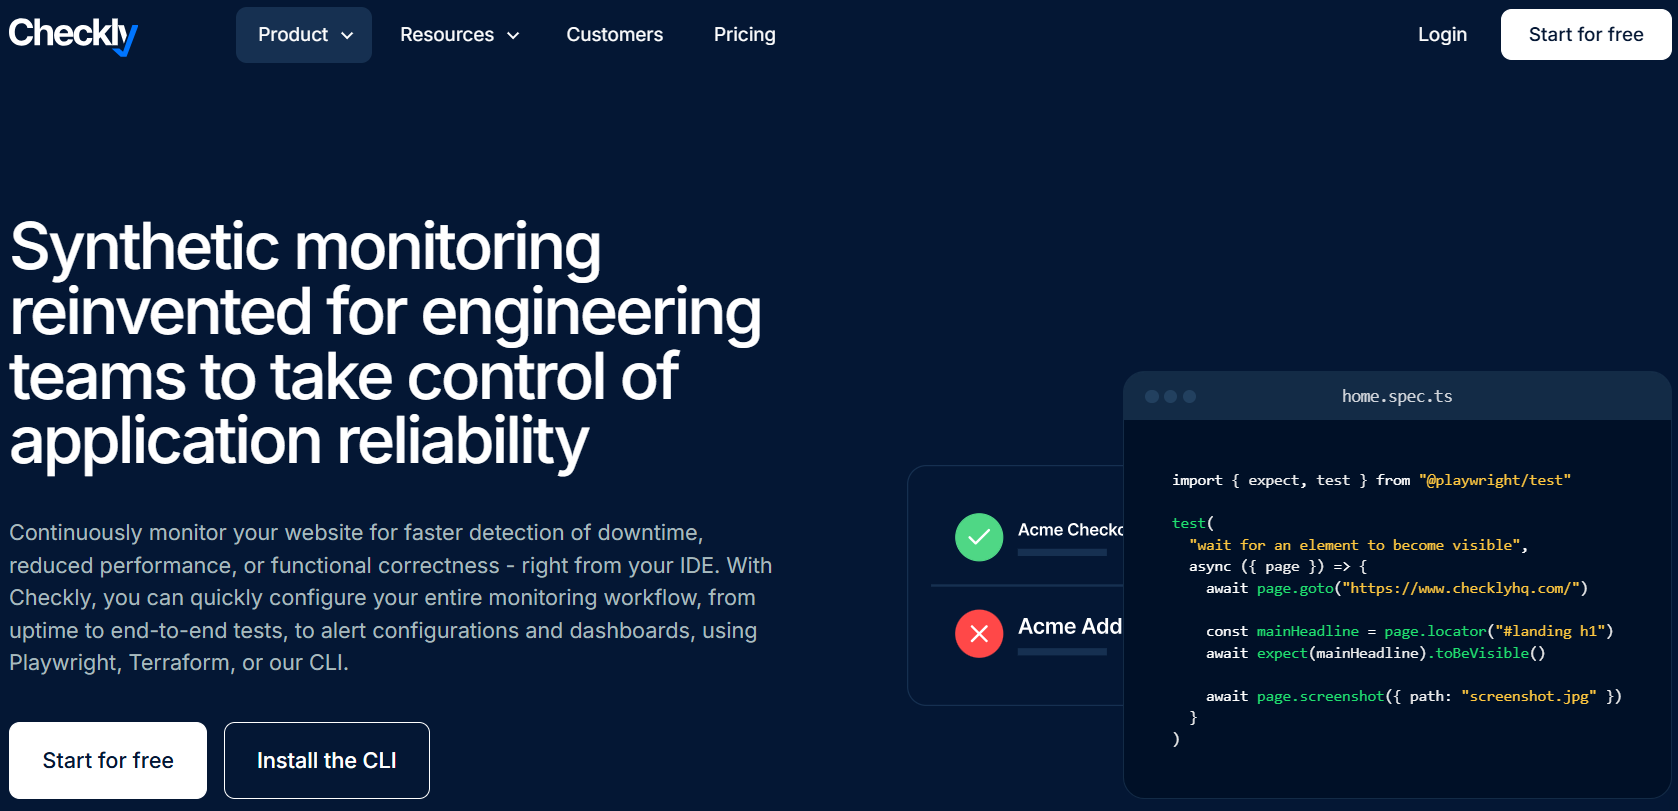
Unreliable web applications or API failures can disrupt user journeys and slow development cycles. Checkly provides developer focused synthetic monitoring, using Playwright based browser checks and API assertions to continuously test critical flows.
Integrated with CI/CD pipelines, it ensures code changes are validated before reaching users. With clear alerts, detailed test results, and easy automation, teams can quickly spot and fix issues, maintain consistent performance, and deliver reliable, seamless digital experiences while reducing downtime and improving overall application quality.
- Best for: Engineering teams automating synthetic E2E checks in CI/CD.
- Highlights: Playwright scripts, API checks, Git based workflows, alerts.
- Pros: Code first, easy to version and review.
- Cons: Needs pairing with RUM/APM for full stack visibility.
10. Sematext Cloud
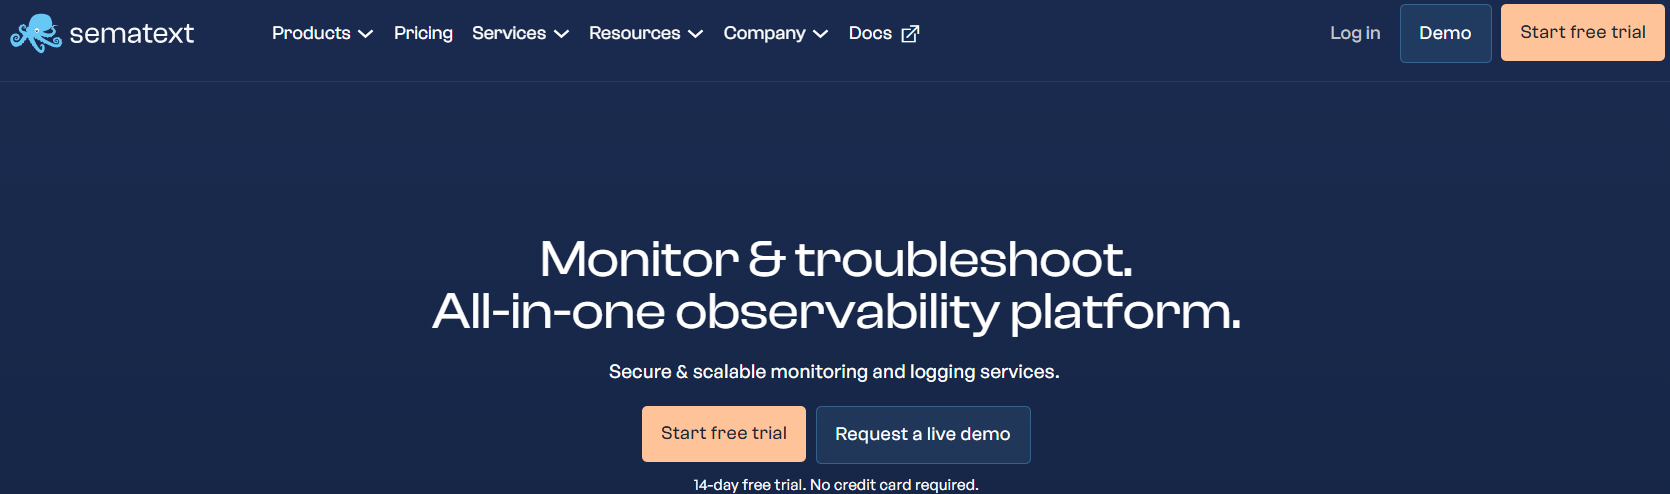
Maintaining smooth application performance across devices and locations can be challenging for growing teams. Sematext Cloud offers an all in one solution, combining synthetic monitoring, RUM, logs, metrics, and infrastructure tracking in a cost friendly package.
It provides clear insights, actionable alerts, and easy setup, helping SMBs and mid market teams quickly identify bottlenecks, optimize performance, and ensure reliable digital experiences without managing multiple tools or complex integrations.
- Best for: Teams seeking balanced features and value.
- Highlights: Website and API monitoring, logs, container/K8s monitoring.
- Pros: Simple pricing, quick setup, good coverage.
- Cons: Fewer enterprise bells and whistles than top tier suites.
11. Honeycomb
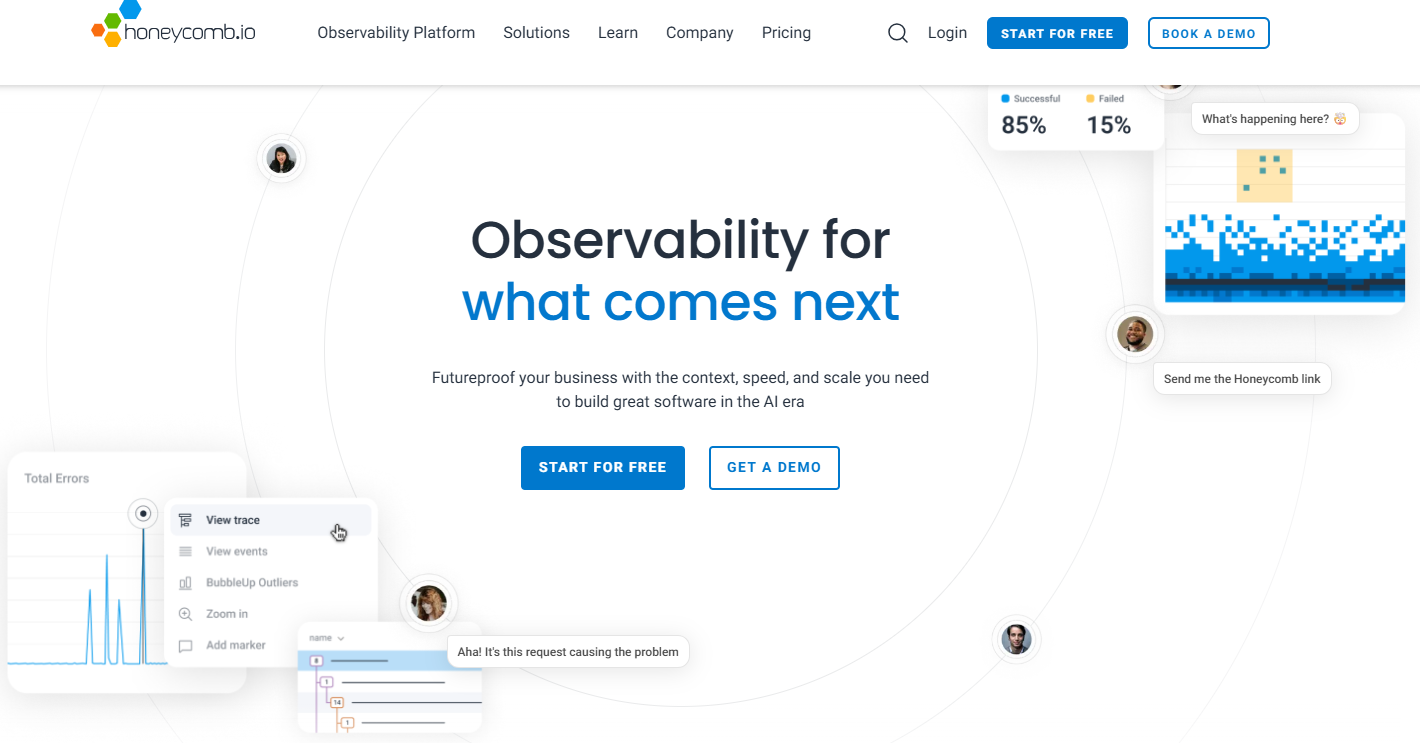
Managing complex microservices and pinpointing hidden performance issues can be overwhelming for SRE and DevOps teams. Honeycomb tackles this with event based observability and high cardinality querying, allowing rapid root cause analysis across intricate systems.
Its powerful features like BubbleUp, trace analysis, and OpenTelemetry support make exploring unknown issues faster and more precise.
While not a full all in one suite, pairing Honeycomb with RUM or synthetic monitoring delivers comprehensive end-to-end insights, helping teams debug, optimize, and maintain reliable, high-performing applications with confidence.
- Best for: Advanced SRE/DevOps teams with deep tracing needs.
- Highlights: BubbleUp, trace analysis, OTel support, powerful queries.
- Pros: Fast incident exploration, great for unknown unknowns.
- Cons: Less traditional “all-in-one”; pair with synthetics/RUM for full E2E.
Quick Comparison Snapshot
- Fast start and broadest ecosystem: Datadog, New Relic
- AI root cause at enterprise scale: Dynatrace, Splunk Observability
- Open, OSS aligned stack: Grafana Cloud, Elastic Observability
- Business transaction APM: Cisco AppDynamics
- Frontend error + performance: Sentry
- Code first synthetics: Checkly
- Value focused all rounder: Sematext Cloud
- Advanced trace analytics: Honeycomb
E2E Monitoring for a WordPress + WooCommerce Store – Real World Setup
- Synthetics: Script a browser journey home > category > product > add to cart > checkout, from 5+ regions.
- RUM: Track Core Web Vitals (LCP, INP, CLS), geographies, devices, and key paths (search, checkout).
- APM: Instrument PHP and critical services (cache, DB, payment gateways) with OpenTelemetry agents.
- Infra: Monitor NGINX/Apache, PHP-FPM, MySQL, Redis, and Kubernetes nodes/pods if applicable.
- Logs: Centralize NGINX and application logs, enable structured logging for searchability.
- Alerting: SLOs for availability and p95 page load; on call routing to Slack/Teams with incident templates.
Example synthetic test using Playwright style JavaScript (works in tools like Checkly):
import { test, expect } from '@playwright/test';

test('WooCommerce checkout flow', async ({ page }) => {
  await page.goto('https://yourstore.com');
  await expect(page).toHaveTitle(/Your Store/i);

  await page.click('text=Shop');
  await page.click('text=Add to cart', { timeout: 15000 });
  await page.click('text=Cart');
  await page.click('text=Proceed to checkout');

  await page.fill('#billing_email', 'synthetic@example.com');
  await page.fill('#billing_first_name', 'Synth');
  await page.fill('#billing_last_name', 'Check');
  await page.click('#place_order');

  await expect(page.locator('text=Order received')).toBeVisible({ timeout: 30000 });
});
Pair this with RUM for real users, APM for PHP/database bottlenecks, and logs for error forensics. Set SLOs (e.g., 99.9% uptime, p95 checkout < 3s) and alert on burn rate to catch degradations early.
Best Practices for 2026 Monitoring
- Adopt OpenTelemetry: instrument once, switch vendors later without rework.
- Measure user centric outcomes: prioritize Core Web Vitals and key transactions.
- Define SLOs with error budgets: align engineering priorities with business goals.
- Automate in CI/CD: run synthetic checks on every deploy and block risky releases.
- Right size data: leverage sampling, retention policies, and analytics tiers to control cost.
- Unify alerts: reduce noise with correlation and send actionable, routed alerts.
- Secure by design: enforce SSO, RBAC, data masking, and audit logs across tools.
Why Pair Monitoring with Fast, Stable Infrastructure – Hosting Matters
Monitoring shows you where performance breaks; great hosting prevents many of those breaks. On optimized infrastructure, you’ll see fewer slow queries, faster TTFB, and steadier Core Web Vitals.
At YouStable, our optimized WordPress hosting, SSD/NVMe storage, and proactive security hardening help your monitoring data trend the right way faster pages, fewer incidents, happier users.
If you’re migrating to a modern observability stack, consider aligning it with a scalable hosting plan. We can help you benchmark TTFB, tune PHP-FPM/MySQL, and set realistic SLOs before you roll out a new tool. The result: cleaner dashboards and fewer false alarms.
FAQs
What’s the difference between observability and monitoring?
Monitoring tracks known conditions and KPIs (e.g., uptime, errors). Observability lets you explore unknown issues using logs, metrics, and traces. End-to-end tools increasingly deliver both: proactive monitoring plus deep, ad-hoc investigation.
Do I need both synthetic monitoring and RUM?
Yes. Synthetic monitoring checks critical flows from consistent locations on a schedule, catching issues before users do. RUM captures real world performance across devices, networks, and regions. Together, they provide full coverage of digital experience.
Which tool is best for WordPress or WooCommerce?
For an all in one, Datadog, New Relic, or Grafana Cloud are strong. If you prefer modular, pair Checkly (synthetics) + Sentry (frontend/backend errors) + Grafana Cloud (metrics/logs/traces). Host on optimized infrastructure like YouStable to unlock better baseline performance.
How do I set SLOs for my app?
Start with user impacting indicators: availability of critical journeys and p95/p99 latency. Use historic data to set realistic targets (e.g., 99.9% checkout success, p95 < 3s). Track error budgets and alert on burn rate to prioritize fixes before customers feel pain.
Is OpenTelemetry mandatory in 2026?
Mandatory, no practical, yes. OTel standardizes telemetry across languages and vendors, reduces lock in, and speeds instrumentation. Most leading tools in this list support OpenTelemetry, making it a smart default for new services.