Infrastructure monitoring tools are platforms that collect, correlate, and visualize metrics, logs, and traces across servers, networks, databases, containers, and cloud services to detect issues and maintain SLAs.
The best tools in 2026 unify observability with AI driven insights, automated discovery, and Kubernetes native support to reduce MTTR and scale across hybrid and multi cloud environments. If you run modern workloads, choosing the right infrastructure monitoring tools is one of the highest ROI decisions you’ll make in 2026.
In this in depth guide, I evaluate the 11 best options for cloud, on‑prem, and hybrid stacks, focusing on reliability, visibility, and total cost of ownership. Whether you’re an SMB or an enterprise SRE team, this comparison highlights what each platform does best and how to pick the perfect fit.
Search Intent and How This Guide Helps
People searching for “best infrastructure monitoring tools” want a shortlist, clear pros and cons, pricing guidance, and Kubernetes/cloud native support details. This guide follows that intent with concise comparisons, beginner friendly explanations, and practical recommendations based on 12+ years of hands on experience in servers, hosting, and observability.
How We Chose the 11 Best Infrastructure Monitoring Tools?

- Coverage: Servers, VMs, containers, Kubernetes, databases, networks, and cloud services (AWS, Azure, GCP).
- Data depth: First class support for metrics, logs, traces, synthetic checks, and real user monitoring (where relevant).
- Ease of use: Fast onboarding, auto discovery, robust dashboards, and sane default alerting.
- Scale and reliability: Horizontal scalability, high cardinality support, and efficient storage.
- Open standards: Native or strong support for OpenTelemetry (OTel) to avoid lock in.
- Integrations: Out of the box plugins for common stacks (Nginx, MySQL, Redis, Kafka, Kubernetes).
- Value: Transparent pricing, predictable billing, and an overall strong TCO for 2026 budgets.
11 Best Infrastructure Monitoring Tools in 2026
1. Datadog
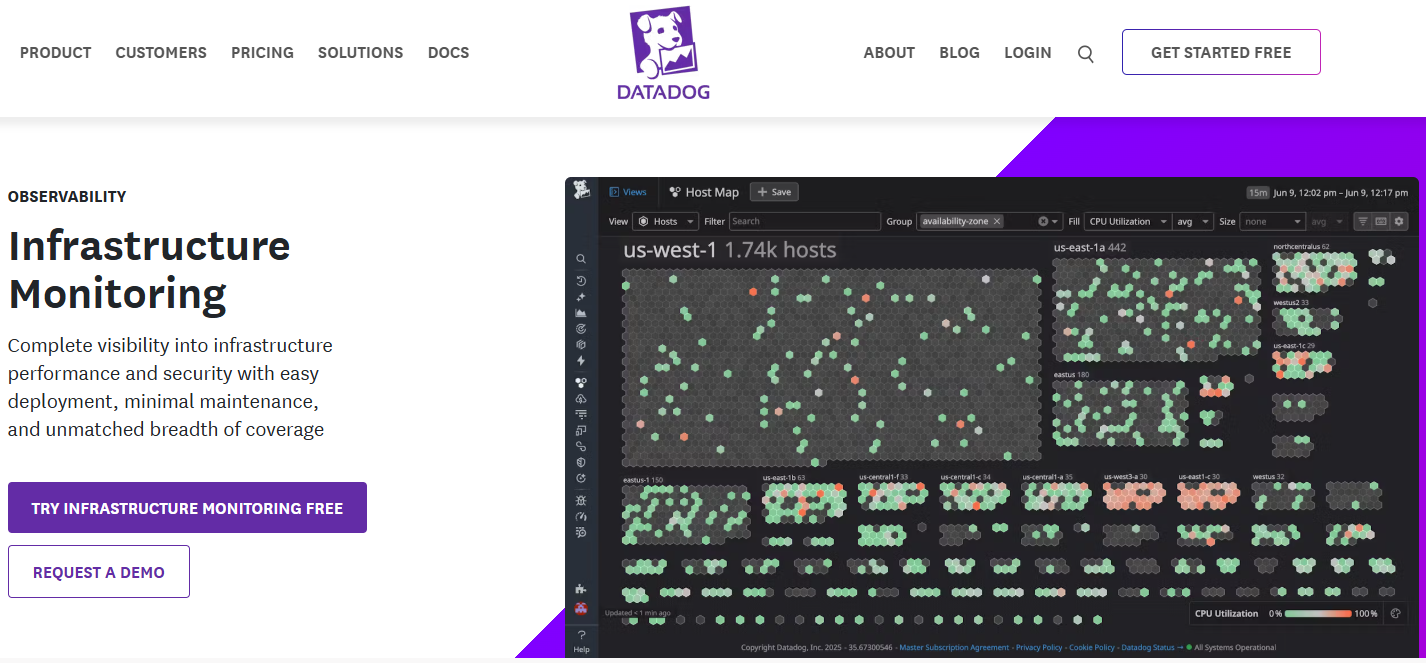
Datadog unifies infrastructure monitoring, APM, logs, RUM, and security into one SaaS platform with excellent integrations and dashboards. It shines in cloud native and Kubernetes environments with auto discovery, topology maps, and ML assisted alerts.
- Best for: Teams needing a single pane of glass across hybrid stacks.
- Standout features: 600+ integrations, service maps, Watchdog (AI), CI visibility, synthetics.
- Pros: Fast setup, rich ecosystem, strong Kubernetes insights.
- Cons: Can get costly at scale; watch data volume and retention.
2. Dynatrace
Dynatrace offers deep auto discovery, code level tracing, and Davis AI for root cause analysis. It’s a favorite for large enterprises that prioritize autonomous operations, precise problem detection, and end to end service health.
- Best for: Enterprises and regulated industries.
- Standout features: OneAgent, Davis AI, automatic dependency mapping, Kubernetes & cloud intelligence.
- Pros: Powerful automation, low noise alerts, performance baselining.
- Cons: Premium pricing and configuration complexity for smaller teams.
3. New Relic
New Relic is now heavily OTel centric with broad ingestion for metrics, logs, and traces, plus infrastructure monitoring and APM. It’s great for teams standardizing on open standards and needing flexible, usage based pricing.
- Best for: OTel adopters, engineering teams consolidating tools.
- Standout features: Telemetry Data Platform, APM, Kubernetes Explorer, NRQL queries.
- Pros: Strong data model, generous integrations, good value at moderate scale.
- Cons: Query and dashboarding can feel complex for beginners.
4. Grafana Cloud
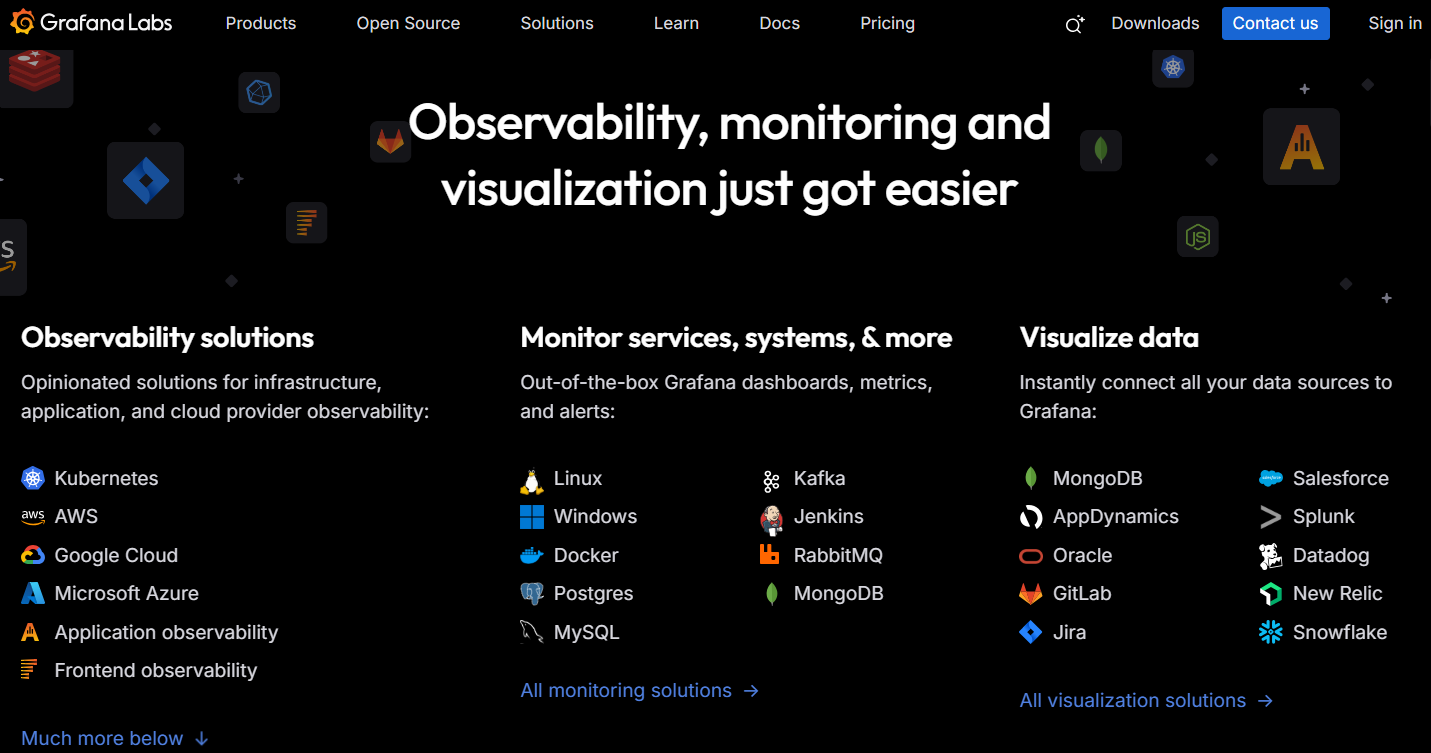
Grafana Cloud delivers hosted Grafana dashbolards with managed Mimir (metrics), Loki (logs), and Tempo (traces). It’s ideal for teams who love open source Grafana but want SaaS ease, alerting, and long term storage without running the stack themselves.
- Best for: Teams moving from DIY Grafana + Prom/Loki to SaaS.
- Standout features: World class dashboards, alerting, synthetic monitoring, k6 performance testing.
- Pros: Familiar OSS experience, good free tier, great Kubernetes visibility.
- Cons: Query learning curve; careful planning needed for high cardinality metrics.
5. Prometheus + Alertmanager
Prometheus is the de facto standard for scraping metrics from cloud native workloads. Paired with Alertmanager, it offers powerful, flexible alerting. Use with Grafana for dashboards and Thanos/Cortex/Mimir for long term storage and global view.
- Best for: SREs and DevOps teams comfortable with OSS operations.
- Standout features: Pull based scraping, service discovery, PromQL, recording rules.
- Pros: Free, Kubernetes native, highly extensible.
- Cons: Operating HA, retention, and federation adds complexity; logs/traces require additional components.
6. Zabbix
Zabbix is a mature open source platform with strong SNMP support, agent/agentless monitoring, and a large library of templates for servers, network gear, and applications. It’s reliable for traditional data center and hybrid setups.
- Best for: Mixed Windows/Linux and network heavy environments.
- Standout features: Templates, autodiscovery, escalations, flexible alerting.
- Pros: No license fees, efficient at scale, active community.
- Cons: UI feels dated; Kubernetes native features require extra effort.
7. Elastic Observability
Elastic (ELK) brings logs, metrics, and APM together with powerful search and analytics. It’s excellent when log search is the primary need, complemented by infrastructure monitoring and APM for full stack visibility.
- Best for: Log heavy organizations and security minded teams.
- Standout features: Kibana dashboards, machine learning jobs, APM agents, Uptime.
- Pros: Scalable search, flexible ingestion, good value self managed or SaaS.
- Cons: Resource hungry if self hosted; tuning and lifecycle policies require expertise.
8. LogicMonitor
LogicMonitor offers agentless and agent based monitoring with strong auto discovery for servers, network devices, storage, and cloud services. It’s a great fit for IT operations that want deep device coverage without managing an on prem stack.
- Best for: Mid market to enterprise hybrid environments.
- Standout features: Topology mapping, dynamic thresholds, broad device library.
- Pros: Quick to value, strong network monitoring, clean dashboards.
- Cons: Pricing is enterprise oriented; limited built in tracing.
9. PRTG Network Monitor
PRTG uses a “sensor” model to monitor network devices, bandwidth, servers, and popular applications. Its guided setup and visual maps make it appealing for small to mid sized IT teams.
- Best for: SMBs and network centric monitoring.
- Standout features: Auto discovery, maps, SNMP/Flow/WMI, customizable notifications.
- Pros: Easy onboarding, predictable licensing, great network visibility.
- Cons: Less depth in logs/traces; scaling sensors needs planning.
10. Checkmk
Checkmk combines performance and simplicity with a powerful agent, smart service discovery, and efficient monitoring core. It’s strong in mixed environments that need reliability and low overhead.
- Best for: Hybrid estates seeking an on prem first solution.
- Standout features: Auto service discovery, intuitive rules, strong Linux/Windows coverage.
- Pros: Resource efficient, pragmatic UI, predictable scaling.
- Cons: Fewer SaaS style bells and whistles; tracing requires external tools.
11. ManageEngine OpManager
OpManager delivers solid device and server monitoring with extensive device templates and configuration management options via add-ons. It’s a cost effective choice for IT operations standardizing on ManageEngine’s ecosystem.
- Best for: IT teams favoring on prem tools and unified IT suites.
- Standout features: Device templates, NetFlow add-ons, config backups, alerts/escalations.
- Pros: Good value, easy device onboarding, broad vendor support.
- Cons: Advanced observability (logs/traces) requires separate products.
Quick Comparison: Which Tool Fits Your Stack?
- If you want one SaaS to do it all: Datadog, Dynatrace, or New Relic.
- If you love open source and control: Prometheus (+ Alertmanager) with Grafana or Checkmk/Zabbix.
- If logs are your center of gravity: Elastic Observability.
- If your network estate is large: LogicMonitor or PRTG; OpManager for on prem budget friendliness.
- If you’re migrating from DIY Grafana: Grafana Cloud for managed OSS without heavy lifting.
Buying Guide: How to Choose Infrastructure Monitoring Tools in 2026
- Stack coverage: Confirm native support for Kubernetes, containers, server OSes, databases, and cloud services you use.
- Data depth: Metrics, logs, traces, synthetics, and RUM. If you only need infra + logs, don’t overpay for advanced APM.
- OpenTelemetry: Prefer OTel ingestion to reduce vendor lock in and simplify instrumentation.
- Alert quality: Look for anomaly detection, SLOs/error budgets, and noise reduction to cut pager fatigue.
- Scalability: Handle high cardinality labels (Kubernetes) and long term retention without runaway costs.
- Integrations: Choose tools with templates and out of the box dashboards for your tech stack.
- Pricing model: Understand ingestion based versus host/sensor based pricing. Estimate 90th percentile usage, not the average.
- Security and compliance: RBAC, SSO/SAML, audit logs, data residency for regulated environments.
Implementation Checklist (Works for Any Tool)
- Inventory: List all services, clusters, nodes, databases, and network devices.
- Golden signals: Define latency, traffic, errors, saturation (and SLIs/SLOs) per service.
- Baseline dashboards: Create runbooks with “red/green” health and drill downs.
- Alert policy: Route by severity; add suppression, maintenance windows, and on call schedules.
- Cost guardrails: Tag data sources, set retention by importance, and cap high cardinality metrics.
# Example: Prometheus alert to catch high error rates on HTTP services
groups:
- name: service.rules
  rules:
  - alert: HighErrorRate
    expr: sum(rate(http_requests_total{status=~"5.."}[5m]))
          / sum(rate(http_requests_total[5m])) > 0.05
    for: 10m
    labels:
      severity: critical
    annotations:
      summary: "High error rate > 5% for 10m"
      description: "Service {{ $labels.job }} is returning 5xx above threshold."
Real World Scenarios and Recommendations
- Kubernetes heavy startup: Start with Grafana Cloud or Datadog for fast value; migrate to OSS components later if costs rise.
- Enterprise with strict SLAs: Dynatrace or Datadog for AI driven root cause and automated dependency mapping.
- Network first SMB: PRTG or OpManager; add Elastic or Grafana Cloud if you later need deeper logs.
- Open source preference: Prometheus + Alertmanager + Grafana, with Thanos/Mimir for long retention; add Loki/Tempo for logs/traces.
- Log centric troubleshooting: Elastic Observability plus lightweight metrics from Prometheus or native Elastic agents.
FAQs
What is the difference between monitoring and observability?
Monitoring collects known signals (metrics, logs, traces) and checks them against thresholds. Observability extends this by making it easy to understand unknown issues through rich, correlated telemetry and context—service maps, spans, attributes—so you can ask new questions without predefining every metric.
Which infrastructure monitoring tool is best for Kubernetes?
Prometheus + Grafana is the Kubernetes native baseline. For managed SaaS convenience, Datadog, Dynatrace, New Relic, and Grafana Cloud offer automatic discovery, pod level visibility, and workload maps with less operational overhead.
Are open source tools enough for enterprises?
Yes—with the right engineering investment. Prometheus, Alertmanager, Grafana, Loki, and Tempo can meet enterprise needs, especially when paired with Thanos/Mimir. Many organizations choose a hybrid: OSS for baseline metrics/logs and a SaaS platform for advanced analytics and incident response.
How much do infrastructure monitoring tools cost?
Costs vary by pricing model: host- or sensor based (PRTG, OpManager), usage/ingestion (Datadog, New Relic, Grafana Cloud, Elastic), or fully self managed (Prometheus/Zabbix/Checkmk). Estimate peak ingestion, cardinality, and retention to avoid bill shock, and tag telemetry to enforce data policies.
What should we monitor first to reduce downtime fast?
Start with the golden signals, latency, traffic, errors, and saturation, on your highest impact services. Add health checks on databases, queues, and external dependencies. Implement a clear on call rota, actionable alerts, and runbooks. Then expand into logs/traces and SLOs for continuous reliability.
Conclusion
In 2026, the “best” infrastructure monitoring tool is the one that fits your stack, skills, and budget and scales without drama. Use this shortlist to align requirements with capabilities, start with high impact signals, and evolve deliberately. If you’d like expert help deploying a right sized stack, YouStable can guide you end to end.