Application performance monitoring tools are platforms that collect metrics, traces, logs, and user data to detect, diagnose, and prevent slowdowns across modern apps. The 11 best APM tools in 2026 are Datadog, Dynatrace, New Relic, AppDynamics, Splunk APM, Elastic APM, IBM Instana, Sentry, Grafana Cloud, AWS X-Ray, and Azure Application Insights.
If your app touches microservices, Kubernetes, serverless, or WordPress at scale, the right application performance monitoring tools help you find the exact bottleneck before users feel it. In this guide, I’ll compare the best APM software in 2026, explain how to choose one, and show a practical setup using OpenTelemetry.
What is Application Performance Monitoring (APM)?
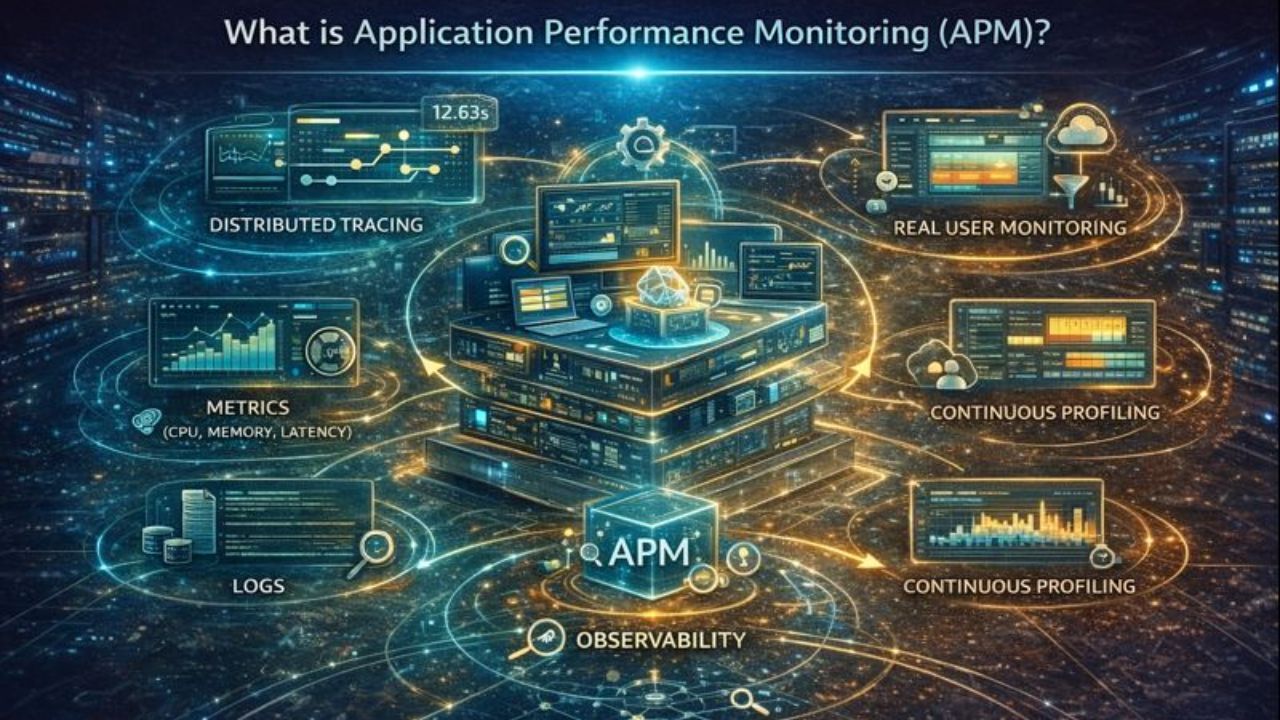
Application Performance Monitoring (APM) tracks how your code executes in production by combining distributed tracing, metrics (CPU, memory, latency), logs, real user monitoring, and sometimes continuous profiling. The goal is fast, reliable releases and fewer incidents through deep visibility, root cause analysis, and proactive alerting.
APM is a core pillar of observability. Think of observability as the broad capability to answer any question about system behavior, and APM as the application centric slice focused on requests, transactions, and end user experience.
How to Choose the Right APM Tool in 2026
- Tech stack coverage: First class support for your languages (Java, .NET, Node.js, Python, Go, PHP), frameworks, and databases.
- Distributed tracing: End to end traces across microservices, queues, and serverless with low sampling bias.
- OpenTelemetry support: Native OTLP ingest, semantic conventions, and pipeline flexibility to avoid lock in.
- Kubernetes and cloud: Auto discovery, service maps, K8s workload context, and cloud native integrations (AWS, Azure, GCP).
- RUM and synthetic: Real User Monitoring plus synthetic checks for SLAs and funnel analysis.
- AI/ML insights: Noise reduction, anomaly detection, and guided root cause to cut MTTR.
- Cost model: Predictable pricing at your data scale; storage tiers and retention you can control.
- Security and access: SSO, RBAC, audit logs, data masking for PII.
- Business context: SLI/SLO tracking, error budgets, and dashboards your product team will actually use.
Quick Comparison: Best APM Tools in 2026
Name              | Best For                           | Standout Capability                | Pricing Notes (2026, indicative)
------------------|------------------------------------|------------------------------------|----------------------------------
Datadog APM       | Cloud-native teams, scale-ups      | Unified APM+Logs+RUM+Profiler      | Usage-based; can spike with volume
Dynatrace         | Large enterprises, K8s at scale    | OneAgent + Davis AI RCA            | Host units; premium but comprehensive
New Relic         | All-in-one telemetry, SMB to Ent   | Usage-based NRDB, quick onboarding | Ingest-based; watch data volumes
AppDynamics       | Enterprises, business transactions | Deep BT mapping & baselining       | Tiered enterprise pricing
Splunk APM        | High-throughput microservices      | NoSample tracing + AlwaysOn prof   | Observability Suite; usage-based
Elastic APM       | Self-hosted & budget-conscious     | OSS-friendly, powerful search      | Free self-hosted; Elastic Cloud tiers
IBM Instana       | Auto-discovery, 1s granularity     | Automatic instrumentation          | Host-based; strong enterprise fit
Sentry Performance| Dev-centric perf & errors          | Code-level insights for dev flows  | Event-based; cost-efficient
Grafana Cloud     | OSS-native stacks                  | Prometheus+Loki+Tempo+Pyroscope    | Generous free tier; data-based plans
AWS X-Ray         | AWS-centric teams                  | Deep AWS integrations              | Per-trace/analysis; AWS-only focus
Azure App Insights| Azure-centric teams                | Kusto (KQL) analytics + APM        | Ingestion-based; Azure-first
The 11 Best Application Performance Monitoring Tools in 2026
1. Datadog APM
Full stack observability with APM, logs, RUM, synthetics, continuous profiler, and strong Kubernetes support. Watchdog surfaces anomalies automatically.
- Best for: Cloud native teams that want a unified platform.
- Pros: Deep integrations, fast time to value, excellent service maps.
- Considerations: Costs can climb fast with high ingest; plan retention.
- Pricing snapshot: Usage based per APM service/host; separate for logs, RUM.
2. Dynatrace
OneAgent auto instruments most stacks. Davis AI correlates dependencies and pinpoints root cause quickly. Grail unifies data for analytics.
- Best for: Enterprises and regulated environments.
- Pros: Minimal manual config, smart problem rollups, robust K8s visibility.
- Considerations: Premium pricing; consult licensing model early.
- Pricing snapshot: Host units; modules for APM, security, and logs.
3. New Relic
New Relic One centralizes metrics, traces, logs, RUM, and synthetics with quick onboarding and good developer UX.
- Best for: Teams wanting one tool across app and user experience.
- Pros: Clear UI, helpful guided install, strong query language.
- Considerations: Usage based ingestion; control high cardinality data.
- Pricing snapshot: Ingest + user pricing; free tier available.
4. AppDynamics
Business transaction centric APM with application maps and baselines; strong for enterprise Java/.NET and SAP landscapes.
- Best for: Enterprise performance governance and executive reporting.
- Pros: BT maps link performance to business impact.
- Considerations: Heavier administration; modern cloud features may lag market leaders.
- Pricing snapshot: Tiered enterprise licensing; consult Cisco partners.
5. Splunk APM
NoSample distributed tracing preserves fidelity under load; AlwaysOn profiling connects code to latency and cost.
- Best for: High throughput microservices and event driven systems.
- Pros: Accurate tail latency analysis, powerful service maps.
- Considerations: Best paired with Splunk Observability Suite; plan for data volumes.
- Pricing snapshot: Usage based; modules for APM, RUM, infrastructure.
6. Elastic APM
Open source agents with Elastic Stack for search and analytics. Great if you prefer self hosted or hybrid deployments.
- Best for: Teams with Elasticsearch expertise and cost control needs.
- Pros: Flexible dashboards, powerful queries, affordable self managed.
- Considerations: You manage scaling, upgrades, and index lifecycle.
- Pricing snapshot: Free self hosted basic; Elastic Cloud subscriptions.
7. IBM Instana
Automatic discovery and instrumentation with one second granularity. Strong visibility into containers and service dependencies.
- Best for: Enterprises seeking low config APM with rapid RCA.
- Pros: Minimal manual setup, clear problem topology, reliable K8s insights.
- Considerations: Enterprise pricing; lean on IBM for sizing.
- Pricing snapshot: Host based licensing with add-ons.
8. Sentry Performance Monitoring
Developer first performance plus error tracking; ties slow endpoints and N+1 queries directly to code and releases.
- Best for: Product teams and startups prioritizing dev velocity.
- Pros: Clean instrumentation, useful release health, great for frontend backend flows.
- Considerations: Not a full infra suite; pair with infra metrics.
- Pricing snapshot: Event based with generous free tier.
9. Grafana Cloud
Prometheus for metrics, Tempo for traces, Loki for logs, and Pyroscope for profiling—fully managed by Grafana Cloud or self hosted.
- Best for: Teams invested in open source observability.
- Pros: Vendor flexibility, great dashboards, cost control levers.
- Considerations: More assembly if self hosted; data modeling matters.
- Pricing snapshot: Free tier; paid by series, logs, traces, profiles.
10. AWS X-Ray
Deep AWS integrations (Lambda, API Gateway, ECS, EKS), native segment and subsegment traces, and CloudWatch metrics/alarms.
- Best for: Workloads primarily on AWS.
- Pros: Lightweight setup with AWS SDKs; cost effective for AWS only stacks.
- Considerations: Limited cross cloud view; advanced features may require pairing with another APM.
- Pricing snapshot: Per trace and analysis charges; CloudWatch priced separately.
11. Azure Application Insights
Tight integration with Azure Monitor, Kusto Query Language (KQL), and powerful dependency maps for .NET/Java apps.
- Best for: Azure first organizations and .NET shops.
- Pros: Seamless Azure pipeline integration, Live Metrics, strong query capabilities.
- Considerations: Azure centric; ingestion volumes impact cost.
- Pricing snapshot: Data ingestion and retention based; sampling helps control cost.
How to Set Up APM the Right Way (Step-by-Step)
- Define goals: Choose SLIs/SLOs (e.g., p95 latency < 300 ms, error rate < 1%).
- Pick a tool: Match language support, OpenTelemetry, and budget.
- Instrument services: Use native agents or OpenTelemetry SDKs with auto instrumentation.
- Trace propagation: Standardize headers (W3C Trace Context) across services and queues.
- Sample smartly: Start with head based sampling; add tail based for critical services.
- Add RUM/synthetics: Validate real user experience and uptime from key geos.
- Alert on symptoms: p95 latency, error surge, saturation; avoid alert storms.
- Review weekly: Tackle top regressions and watch new deployments closely.
# Example: OpenTelemetry (Node.js) exporting to an OTLP endpoint (most APMs support OTLP)
npm install @opentelemetry/api @opentelemetry/sdk-node @opentelemetry/auto-instrumentations-node \
  @opentelemetry/exporter-trace-otlp-http @opentelemetry/exporter-metrics-otlp-http

// tracing.js
const { NodeSDK } = require('@opentelemetry/sdk-node');
const { getNodeAutoInstrumentations } = require('@opentelemetry/auto-instrumentations-node');
const { OTLPTraceExporter } = require('@opentelemetry/exporter-trace-otlp-http');
const { OTLPMetricExporter } = require('@opentelemetry/exporter-metrics-otlp-http');

const sdk = new NodeSDK({
  traceExporter: new OTLPTraceExporter({ url: process.env.OTEL_EXPORTER_OTLP_TRACES_ENDPOINT }),
  metricExporter: new OTLPMetricExporter({ url: process.env.OTEL_EXPORTER_OTLP_METRICS_ENDPOINT }),
  instrumentations: [getNodeAutoInstrumentations()]
});

sdk.start().then(() => console.log('OTel started'));

// Run with env:
# OTEL_SERVICE_NAME=checkout-api
# OTEL_RESOURCE_ATTRIBUTES=deployment.environment=prod
# OTEL_EXPORTER_OTLP_TRACES_ENDPOINT=https://apm.example.com/v1/traces
# OTEL_EXPORTER_OTLP_METRICS_ENDPOINT=https://apm.example.com/v1/metrics
node -r ./tracing.js server.js
Tip: If you host on YouStable VPS or Cloud, our team can preconfigure an OpenTelemetry Collector, secure OTLP endpoints, and a starter Grafana dashboard—so you get actionable APM data on day one without guesswork.
Key Metrics, Traces, and Alerts to Monitor
- Latency: p50/p95/p99 for key transactions and external calls.
- Error rate: HTTP 5xx, exceptions, and failed spans.
- Throughput and saturation: Requests per second, queue depth, CPU/memory.
- Cold starts and GC pauses: Especially for serverless and JVM services.
- Database health: Query latency, lock time, slow queries, connection pool saturation.
- Third party dependencies: Payment gateways, email APIs, CDN edges.
- User experience: Core Web Vitals, RUM funnels, SPA route changes.
Real World Use Cases and Playbooks
E-commerce launch: Enable synthetic checks on top journeys (browse, cart, pay). Alert on p95 latency > 300 ms during campaigns. Use distributed tracing to spot slow database calls and throttle expensive recomputations.
Kubernetes microservices: Auto discover services, add service names to spans, and use golden signals (latency, traffic, errors, saturation) per namespace. Tail based sampling helps catch rare but costly spikes.
WordPress at scale: Combine PHP APM with page cache metrics and RUM. Track slow plugins, external API calls, and MySQL slow logs. At YouStable, we often pair Nginx caching with APM traces to cut TTFB and reduce origin load.
Serverless APIs: Trace cold starts and downstream calls. Use async spans for SQS/Kafka. Alert on elevated duration percentiles and throttling errors.
Pros and Cons of APM in 2026
- Pros: Faster incident response, cleaner deployments, quantifiable UX improvements, better engineering focus.
- Cons: Data costs can surprise; requires governance; noisy alerts if not tuned.
- Mitigation: Adopt OpenTelemetry, apply sampling, define SLOs, and review dashboards monthly.
When to Self Host vs. Use a Managed APM
- Self host (e.g., Elastic, OSS Grafana stack): Best if you need strict data residency, low cost at scale, and have ops expertise.
- Managed (e.g., Datadog, Dynatrace, New Relic): Best for speed, integrated features, and reduced maintenance overhead.
- Hybrid: Send production to managed, keep sensitive logs or PII masked data on self hosted storage.
YouStable can support both: managed APM integrations for speed, or hardened self hosted stacks on dedicated servers with private networking and object storage for cost predictability.
FAQs
What’s the difference between APM and observability?
APM focuses on application transactions, latency, errors, and user experience. Observability is broader: metrics, logs, traces, events, and profiles across apps and infrastructure to answer any operational question. In practice, APM is a core part of an observability strategy.
Which APM tool is best for Kubernetes microservices?
Dynatrace, Datadog, Splunk APM, and Instana are standouts for K8s due to auto discovery, service maps, and strong tracing. If you prefer OSS, Grafana Cloud with Tempo/Prometheus is excellent and OpenTelemetry friendly.
How much does APM cost in 2026?
Expect usage based pricing tied to hosts, services, data ingest, or traces. Costs vary widely by retention, cardinality, and sampling. Start with conservative retention, enable sampling, and separate “debug” from “prod” telemetry pipelines.
Can I use OpenTelemetry with commercial APM tools?
Yes. Most leading platforms ingest OTLP traces/metrics/logs. Use OpenTelemetry SDKs and an OTEL Collector to route data to Datadog, Dynatrace, New Relic, Splunk APM, Grafana Cloud, or Elastic with minimal code changes.
What should I monitor for a WordPress or WooCommerce site?
Track TTFB, Core Web Vitals (LCP, INP), slow PHP hooks, database query time, cache hit rate, and external API latency (payments, shipping). Pair RUM with APM traces to connect user pain to backend causes. YouStable can pre tune these on managed WordPress plans.