Real user monitoring tools capture real visitor performance and UX data (Core Web Vitals, errors, network timing) from your website and apps. The best RUM platforms combine field data, session context, error tracing, and privacy controls to pinpoint slow experiences and quantify their revenue impact across devices, geographies, and releases.
Choosing the best real user monitoring tools in 2026 can dramatically improve page speed, conversion rates, and customer satisfaction. This guide explains RUM in plain language, compares the top 11 tools, and shows exactly how to implement RUM, measure Core Web Vitals, and use insights to prioritize fixes that matter to users and revenue.
What is Real User Monitoring (RUM)?
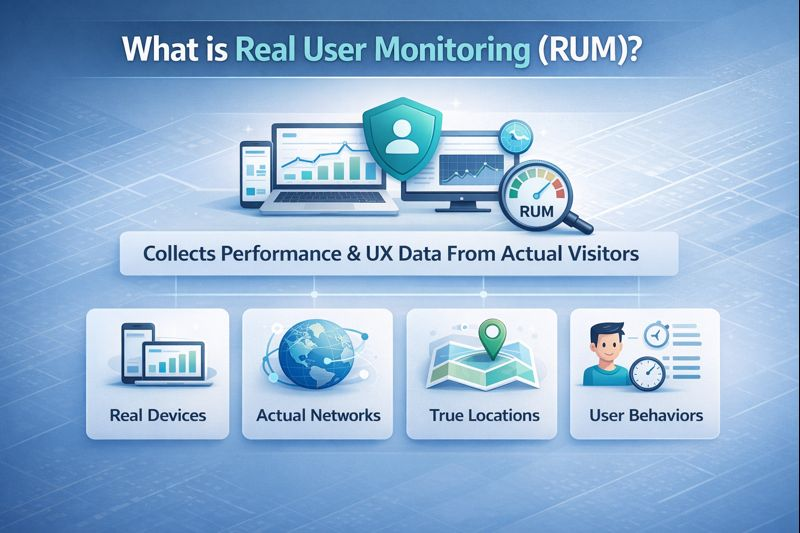
Real User Monitoring (RUM) collects performance and UX data from actual visitors in the browser or mobile app. Unlike lab tests, RUM measures real devices, networks, locations, and behaviors, making it the most reliable way to track Core Web Vitals, front end performance, and perceived speed at scale.
RUM vs. Synthetic Monitoring
Synthetic monitoring runs controlled tests from data centers or edge locations on a schedule. It’s great for uptime and baseline checks. RUM reflects real world variability: device power, 3G vs. 5G, long tail browsers, ad blockers, and user interactions. The best teams use both synthetic for guardrails, RUM for truth in the field.
Core Web Vitals in 2026 – What Matters
In 2026, Google focuses on these user centric metrics:
- Largest Contentful Paint (LCP): How fast the main content appears. Target ≤ 2.5s.
- Interaction to Next Paint (INP): Overall interaction responsiveness. Target ≤ 200ms.
- Cumulative Layout Shift (CLS): Visual stability. Target ≤ 0.1.
RUM tracks these from real sessions, alongside TTFB, Total Blocking Time (TBT), long tasks, resource timing, and JavaScript errors to reveal root causes and regressions.
How to Choose the Best Real User Monitoring Tool?
- Coverage: Web, SPA frameworks, mobile (iOS/Android), and APIs.
- Core Web Vitals: Native field tracking for LCP, INP, CLS, plus long tasks and resource timing.
- Error + Performance: Link JS errors, slow routes, and backend traces for endto end visibility.
- Session Replay: Reproduce UX issues visually with privacy safe masking.
- Sampling & Retention: Control data volume without losing signal; pick the right retention window.
- Privacy & Compliance: PII masking, consent modes, GDPR/CCPA tooling, data residency options.
- Integrations: CI/CD release markers, alerting, dashboards, APM/logs, and issue trackers.
- Ease & Cost: Lightweight script, reliable CDN, transparent pricing at your traffic scale.
11 Best Real User Monitoring Tools in 2026, Feb
Why does a website feel fast during testing but slow for real visitors? That gap is exactly what real user monitoring tools help you see. These tools show how people actually experience your site on their own devices, networks, and locations.
They quietly track Core Web Vitals, user interactions, and errors, then point out what is hurting performance and what deserves attention first. This list covers the top 11 RUM tools that turn real user data into clear, practical insights you can use to improve experience and results.
1. New Relic Browser
Are you frustrated not knowing why your website feels slow for real users? New Relic Browser solves this by collecting performance data directly from visitors’ browsers, showing exactly how your site loads and responds on real devices and networks.
It tracks Core Web Vitals like LCP, INP, CLS, plus JavaScript errors, long tasks, and slow resources. By connecting front end data with backend APM and distributed traces, it helps you quickly pinpoint whether issues come from code, server, or services, so you can prioritize fixes that truly improve user experience.
- Best for: Teams needing full stack visibility and rich querying (NRQL).
- Pros: Mature dashboards, anomaly detection, release markers, precise segmentation.
- Cons: Can be costly at high volumes; learning curve for advanced queries.
- Pricing: Usage based with free tier; cost scales by events and retention.
2. Datadog RUM & Session Replay
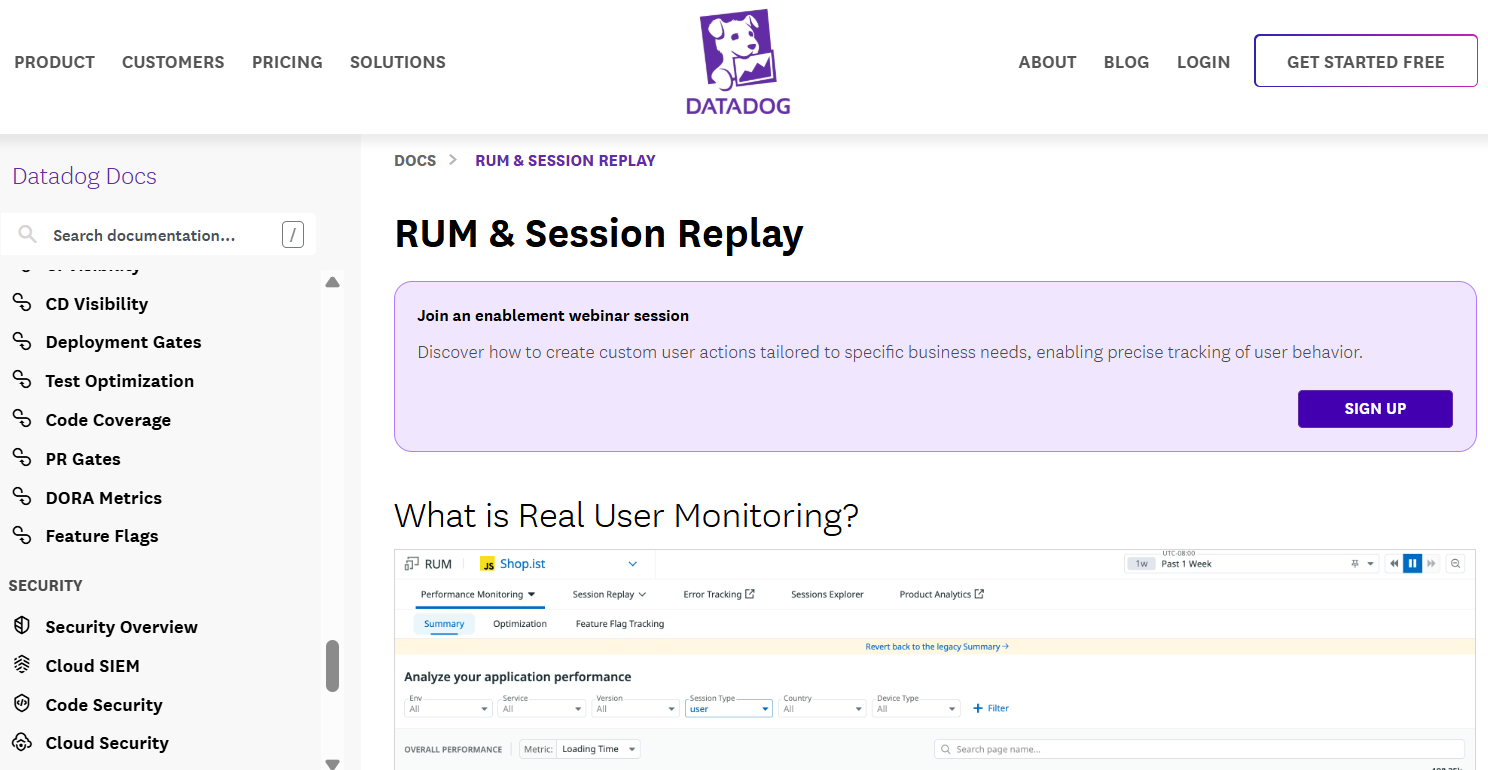
Datadog RUM & Session Replay is a powerful Real User Monitoring solution that helps teams understand how real users experience their websites and applications. It captures live performance data from actual visitors, giving clear insights into page speed, interactions, and overall user experience.
The tool tracks essential Core Web Vitals, JavaScript errors, and detailed network waterfalls that show how each resource loads. Its session replay feature allows teams to watch real user journeys while keeping sensitive data protected through built in privacy controls.
Datadog also connects RUM data with backend APM, logs, synthetic tests, and infrastructure metrics, making it easier to trace issues from the browser to the server. This unified view helps engineering and operations teams quickly identify problems and focus on fixes that improve real user performance.
- Best for: Ops and product teams standardizing on Datadog’s observability stack.
- Pros: End to end correlation, strong alerting, synthetic + RUM in one UI.
- Cons: Pricing complexity; careful sampling required to control spend.
- Pricing: Per session/per event with add-ons for replay and synthetics.
3. Sentry Performance & Replay
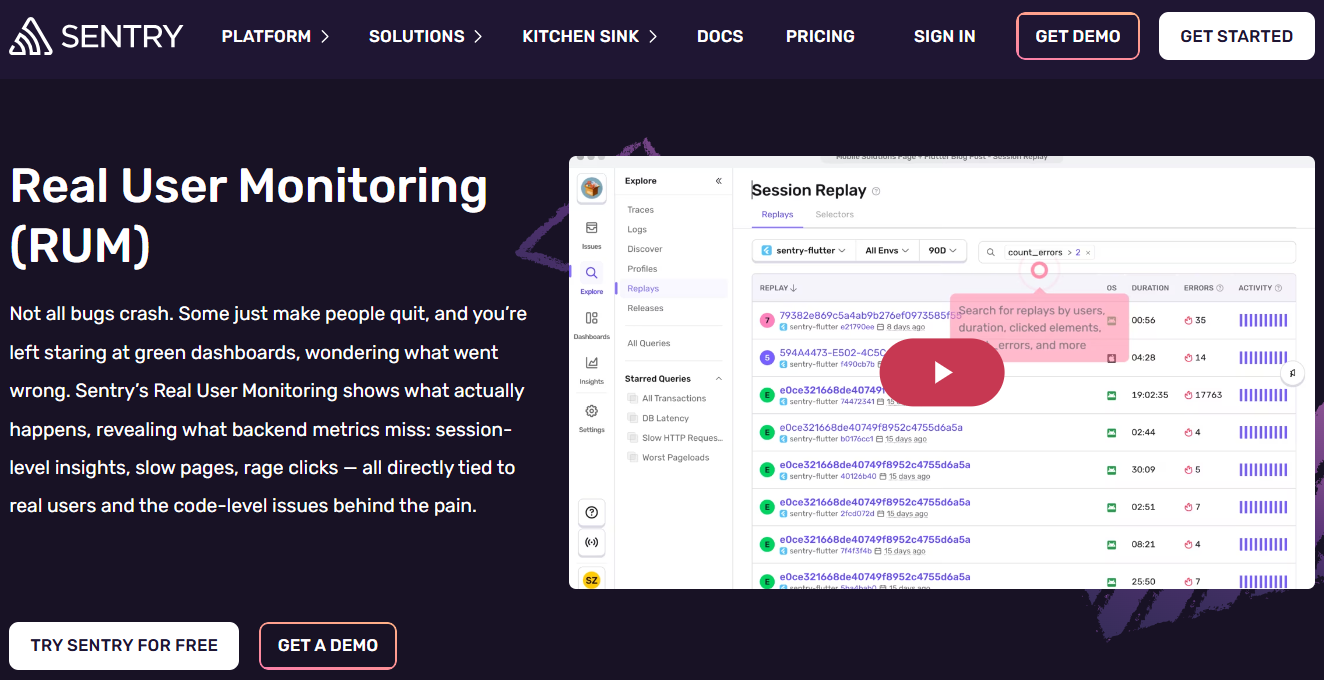
Sentry Performance & Replay is a developer friendly Real User Monitoring tool that focuses on fixing real problems users face on your site or app. It collects performance data directly from real users, so teams can see how their code behaves in everyday situations, not just in test environments.
Sentry clearly highlights slow interactions, long tasks, and performance drops that affect user experience. What makes it especially useful is how easily it connects these issues to specific code changes and releases, helping developers understand exactly what caused a slowdown or regression.
The session replay feature adds more clarity by showing real user journeys, making bugs easier to reproduce and fix. Along with strong JavaScript error tracking, Sentry helps teams act faster and with confidence.
For developers who want clear, actionable insights without unnecessary complexity, Sentry offers a smooth and effective performance monitoring experience.
- Best for: Front end and full stack teams focused on bug and perf fixes.
- Pros: Developer first UI, tight Git integration, smart sampling.
- Cons: Limited infra visibility; may need separate APM/infra tools.
- Pricing: Generous free tier; paid plans by events and replays.
4. Dynatrace Real User Monitoring
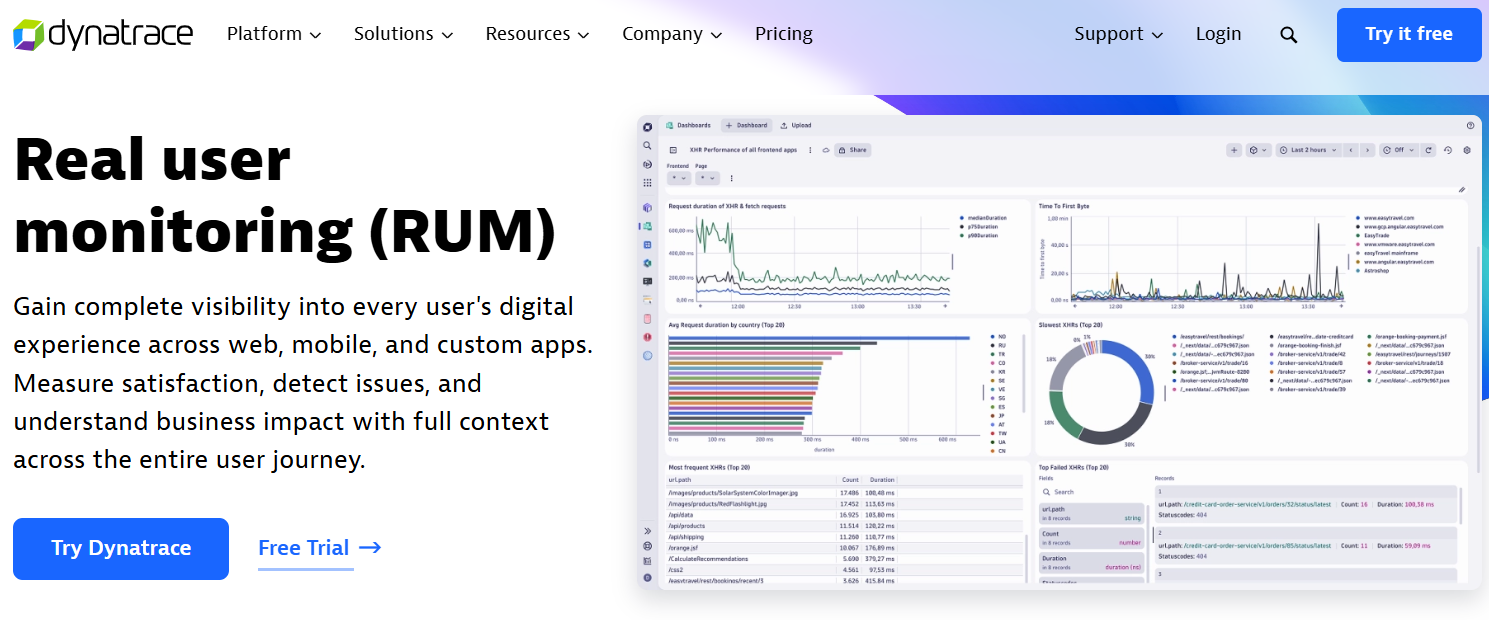
Dynatrace Real User Monitoring is an enterprise level RUM solution built for large and complex applications. It automatically collects real user data from browsers and mobile apps, removing the need for heavy manual setup.
Using Davis AI, Dynatrace quickly identifies the root cause of performance issues instead of just showing symptoms. The platform connects front end user signals with backend services, databases, and infrastructure, giving a complete end to end view of application performance.
It also offers business impact analysis, helping teams understand how slow pages or errors affect conversions and user engagement. Dynatrace is ideal for organizations that need deep automation, accurate insights, and reliable performance monitoring at scale.
- Best for: Large, distributed architectures needing hands off automation.
- Pros: Automatic topology mapping, precise RCA, strong enterprise governance.
- Cons: Premium pricing; advanced features need onboarding time.
- Pricing: Tiered enterprise licensing with usage components.
5. Elastic Real User Monitoring
Elastic Real User Monitoring is a flexible RUM solution designed for teams that want full control over their performance data. It collects real user experience data from browsers and sends it into the Elastic Stack, where teams can analyze, visualize, and correlate it in detail.
Elastic RUM tracks important Core Web Vitals such as LCP, INP, and CLS, along with page load timing and user interactions. A key benefit is its ability to connect browser sessions with backend traces using open source and OpenTelemetry friendly tools.
Teams can choose Elastic Cloud or self hosted deployments, making it attractive for cost control and data ownership. Elastic RUM works best for technical teams that value customization, transparency, and deep performance analysis.
- Best for: Teams comfortable with Elastic wanting cost control and openness.
- Pros: Powerful querying/visualization, self host or cloud, OpenTelemetry friendly.
- Cons: Operational overhead if self managed; replay requires add-ons.
- Pricing: Elastic Cloud usage based; self hosting reduces platform cost.
6. SpeedCurve RUM

SpeedCurve RUM focuses on improving real user experience by combining real user monitoring with advanced front end synthetic testing. It tracks UX focused metrics like Core Web Vitals and shows how design and content changes affect performance.
SpeedCurve is especially known for performance budgets and clear visual dashboards, helping teams quickly see when pages slow down. It is a great choice for front end teams and marketers who want practical, visual insights to guide performance decisions.
- Best for: Performance minded marketers and front end teams.
- Pros: Clear dashboards, Core Web Vitals focus, budget alerts, SPA support.
- Cons: Less depth on errors/APM; not an all in one observability stack.
- Pricing: Plan based with pageview tiers.
7. Akamai mPulse

Akamai mPulse is a high scale Real User Monitoring solution built for websites with large, global traffic. It collects real performance data from users and connects it with CDN delivery paths and edge configurations, helping teams understand how content is served across regions.
mPulse is especially useful for ecommerce and media sites, as it also tracks media and streaming performance. By linking user experience with CDN behavior, it helps teams optimize delivery, reduce latency, and improve performance for users worldwide.
- Best for: High traffic ecommerce, media, and global brands on CDNs.
- Pros: Enterprise scale, CDN aware analytics, anomaly detection.
- Cons: Enterprise oriented contracts; implementation can be complex.
- Pricing: Enterprise quotes based on traffic and modules.
8. Raygun Real User Monitoring
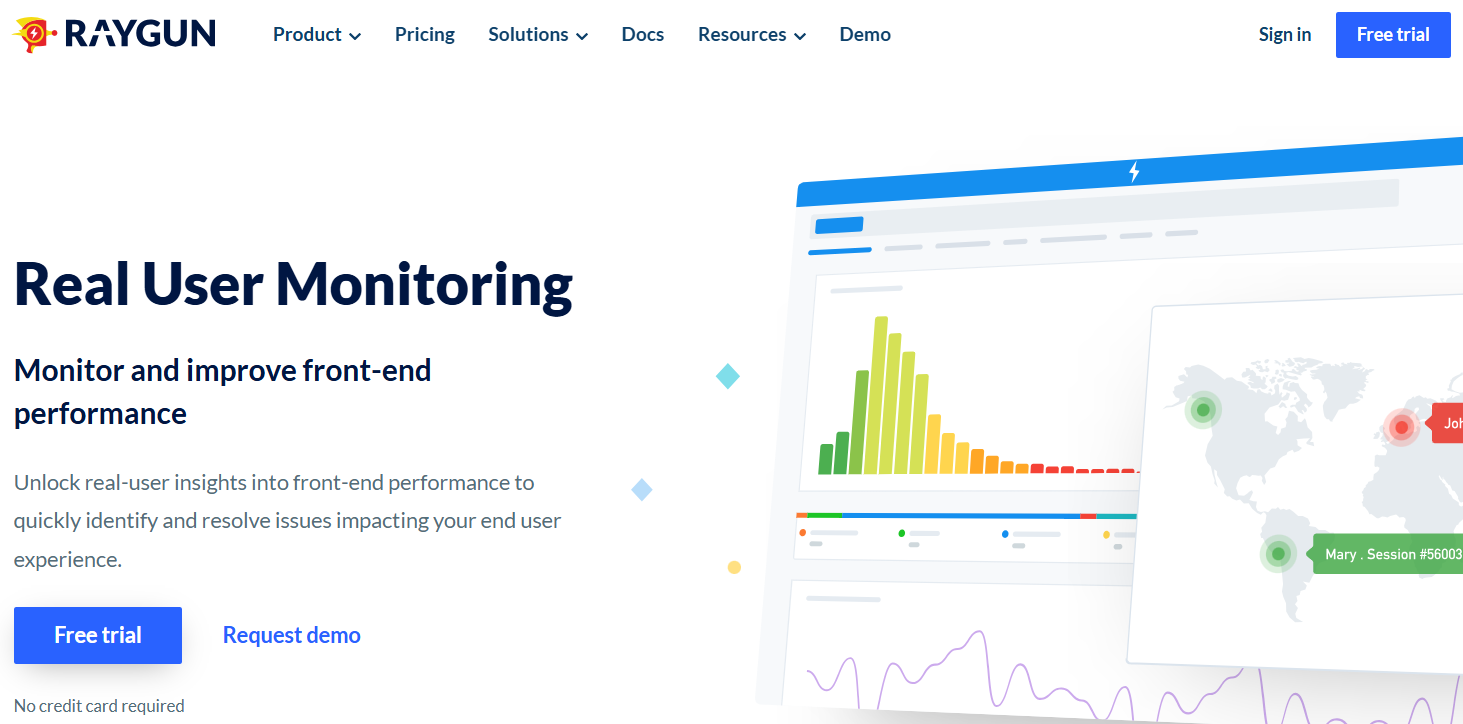
Raygun Real User Monitoring helps teams tackle one of the biggest pain points: not knowing exactly why users experience slow pages or errors. It combines real user monitoring with crash reporting and APM, giving clear, user focused dashboards that highlight slow routes, heavy assets, and affected users.
Setup is quick and intuitive, so teams can start seeing insights fast. By linking performance issues directly to real user impact, Raygun makes it easy to prioritize fixes that improve experience and retention, making it ideal for SMBs and product focused teams.
- Best for: SMBs and product teams wanting fast value and clarity.
- Pros: Friendly UI, actionable insights, good SPA support and geo breakdowns.
- Cons: Smaller integration catalog than bigger suites.
- Pricing: Pageview/session based tiers with add-ons.
9. Pingdom Real User Monitoring (SolarWinds)
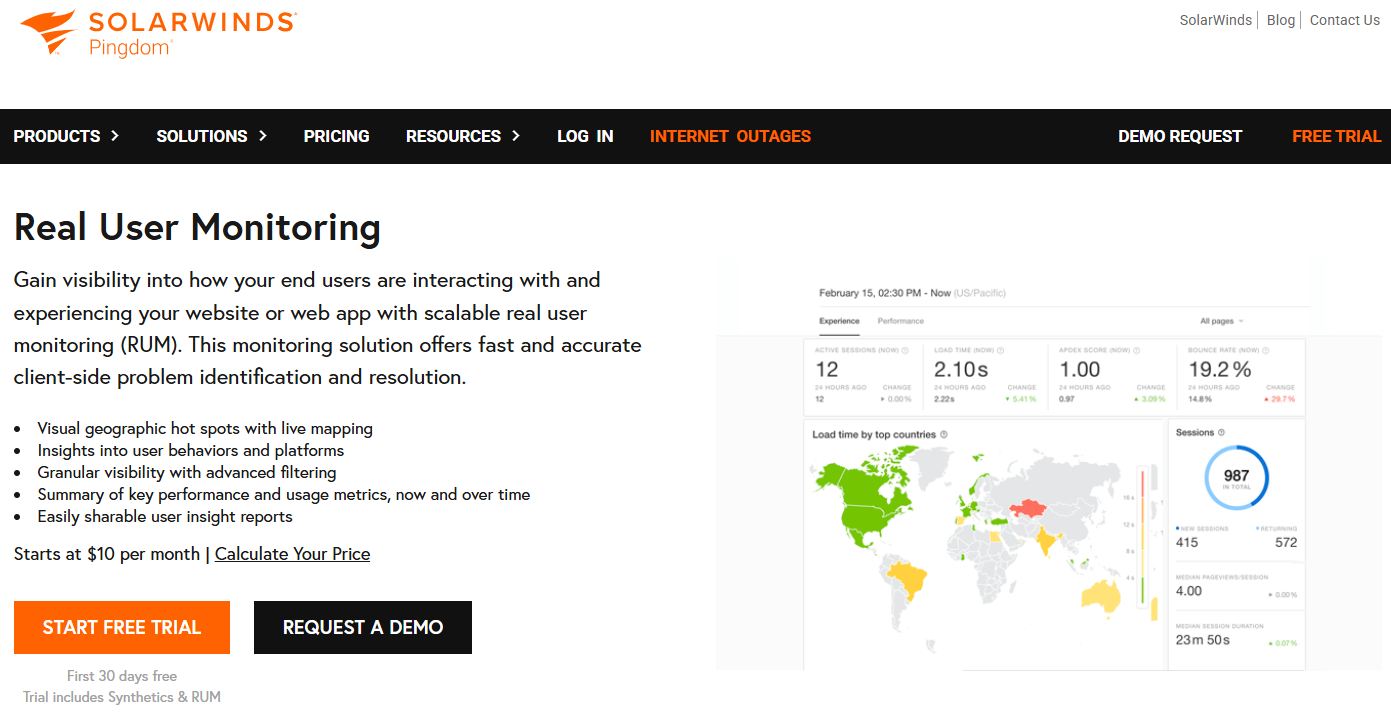
Pingdom Real User Monitoring extends its popular uptime monitoring by tracking real user performance across websites. It captures Core Web Vitals, page load times, and interaction metrics, presenting them in simple, easy to read charts.
Pingdom RUM helps teams quickly spot slow pages, track trends, and understand user experience without complexity. It’s especially useful for small to mid sized teams looking for an accessible, cost effective solution to monitor real world site performance alongside uptime.
- Best for: Teams starting RUM alongside uptime/synthetic checks.
- Pros: Simple setup, readable dashboards, cost effective.
- Cons: Not as deep as full APM suites; limited developer workflows.
- Pricing: Affordable tiers tied to pageviews and checks.
10. Sematext Experience (RUM)

Many teams struggle to understand why users experience slow pages or poor interactions across different devices and locations. Sematext Experience (RUM) solves this by providing real user monitoring with detailed Core Web Vitals, device and geographic segmentation, and actionable insights.
It also integrates smoothly with logs, synthetic tests, and infrastructure metrics, giving a complete view of performance. Sematext is value focused, easy to set up, and simple to operate, making it ideal for teams that want clear, real world insights without complex setups.
- Best for: Cost conscious teams that still want full funnel visibility.
- Pros: Good price to feature ratio, fast onboarding, useful alerts.
- Cons: Smaller ecosystem vs. largest vendors.
- Pricing: Usage based with transparent tiers.
11. Splunk RUM

Many enterprises struggle to pinpoint why users face slow pages or errors across complex applications. Splunk RUM addresses this by capturing real user data from both web and mobile platforms, leveraging OpenTelemetry for consistent, standardized metrics across all apps and services.
It correlates user sessions with backend traces and logs, giving teams a complete end to end view of performance. By connecting user experience to infrastructure and code level insights, Splunk RUM helps large organizations quickly identify, prioritize, and fix issues that impact real users.
- Best for: Enterprises standardizing on Splunk Observability Cloud.
- Pros: Strong analytics and correlation; OTel native; scalable ingestion.
- Cons: Complexity and licensing require careful planning.
- Pricing: Enterprise usage pricing; contact sales for details.
How to Do Real User Monitoring: Tools and Setup
Step 1: Decide What to Measure
- Core Web Vitals: LCP, INP, CLS as your north stars.
- Supporting signals: TTFB, long tasks, resource timing, JS errors.
- Business tie in: Conversions, drop offs, and impacted revenue segments.
Step 2: Install a Lightweight Agent
Most tools provide a single script tag or NPM package. Place it late in the head for accurate timings, enable consent based collection, and mask PII before transmission.
<!-- Example: generic RUM snippet pattern -->
<script>
  (function(){
    var rum = window.MyRumClient && new window.MyRumClient({
      appId: 'YOUR_APP_ID',
      sampleRate: 0.2, // 20% sessions
      maskSelectors: ['[data-sensitive]', 'input[type=password]'],
      enableCoreWebVitals: true
    });
    if (rum) {
      rum.addContext({ release: '2026.01', env: 'production' });
      rum.start(); // begins collecting LCP, INP, CLS, errors, network timing
    }
  })();
</script>
Step 3: Validate and Alert
- QA in staging: verify events, consent, and masking.
- Dashboards: segment by page type, device class, country, release.
- Alerts: notify when p75 LCP or INP breach budgets; roll back on regressions.
Practical Use Cases RUM Solves
- Find slow third party scripts dragging LCP on mobile.
- Catch long tasks causing poor INP in checkout flows.
- Quantify revenue impact when CLS spikes on PDPs.
- Validate that a CDN or image optimization change improved p75 metrics.
- Spot geo specific latency to route traffic or add edge nodes.
Hosting and Infrastructure: The Hidden Lever Behind Better RUM
Real user monitoring exposes server and network bottlenecks. If TTFB is high or edge delivery is inconsistent, even perfect front end code won’t pass Core Web Vitals on mobile. Optimized hosting is foundational for good field performance.
At YouStable, we architect hosting for measurable RUM gains: NVMe powered servers, HTTP/3 (QUIC), modern TLS, full page and object caching, and easy CDN pairing.
For WordPress, our stack supports image compression, Brotli, and server side caching that cuts TTFB and improves LCP in the real world. If your RUM shows backend bound delays or regional slowdowns, upgrading hosting and edge strategy is often the fastest win.
Buying Tips For 2026
- Run a 14-30 day trial with real traffic to estimate volume and cost.
- Enable release markers to correlate code changes with metric shifts.
- Use sampling for replay heavy tools; keep unsampled metrics for accuracy.
- Standardize on OpenTelemetry if you need multi vendor flexibility.
- Set clear SLOs: e.g., p75 LCP ≤ 2.5s, p75 INP ≤ 200ms across top markets.
FAQs
What’s the difference between real user monitoring and synthetic monitoring?
RUM captures field data from real visitors, while synthetic runs scripted tests from controlled locations. Synthetic is ideal for uptime and baseline checks; RUM reveals true user experience across devices, networks, and geos. Use both for full coverage.
Which RUM metrics matter most in 2026?
Prioritize Core Web Vitals: LCP (loading), INP (interactivity), and CLS (stability). Also track TTFB, long tasks, JS errors, and resource timing. Focus on p75 (75th percentile) values, segmented by device class (mobile/desktop) and country.
Is RUM data GDPR/CCPA compliant?
Yes if implemented with privacy controls. Use consent modes, mask PII (inputs, emails, tokens), avoid recording sensitive screens, and select appropriate data residency. Most leading tools offer masking and redaction policies out of the box.
Do small websites need a RUM tool or is GA4 enough?
GA4 offers limited performance insights. A lightweight RUM tool provides richer Core Web Vitals, error context, and network timing. For small sites, budget friendly tools like Sematext, Raygun, or Pingdom RUM can deliver outsized value.
How do I choose between Datadog, New Relic, and Sentry?
Pick Datadog if you want unified observability (RUM + APM + infra). Choose New Relic for deep full stack analytics with flexible queries. Select Sentry for developer first error/performance workflows with strong replay and Git integration.