
I have deployed Grafana on more servers than I can count over the years and last month my research team ran through every step in this guide again from scratch on a brand new VPS.
Nothing in this guide is based on guesses.
You get the exact commands my team typed and the exact screens we saw. Me and my team will tell you the exact fixes we used when something did not work on the first try.
By the time you finish reading, you will know what Grafana does, what your server needs before you open a terminal, and how to get a working, password protected Grafana dashboard live on your own VPS.
My team also tells you which server we used for this test, and why we picked it. Let’s get started.
| Please Note: This guide covers Grafana OSS, the free and open source edition, installed through the official Grafana APT repository. |
My team tested every command below on a fresh Ubuntu 24.04 VPS.
The same commands work on Ubuntu 22.04 and Debian based servers, and I have called out the one place where a step changes slightly.
Before installing anything on your VPS, it helps to know exactly what Grafana does, and why so many engineering teams keep it running on their servers every single day.
Let’s check it out!
What Grafana Actually Does for Your Server
Grafana is an open source data visualization platform. It does not collect or store your metrics on its own. Instead, it connects to a data source you already run, such as Prometheus, MySQL, PostgreSQL, InfluxDB, Loki, or Elasticsearch, and turns that raw data into readable charts, graphs, and alerts on one screen.

My research team uses Grafana to watch CPU load, memory usage, disk space, and application response times across client servers, and a single glance at the dashboard tells us when something needs attention.
- Instead of digging through log files line by line or running the same manual query five times a day, you get a live picture that updates on its own.
- You can also set up alerts that message you on Slack, email, or a webhook the moment a metric crosses a threshold you set.
This is not limited to large engineering teams either.
My team has set up Grafana for small agencies watching a handful of client websites, for solo developers tracking a single side project, and for growing SaaS teams monitoring dozens of servers at once.
The setup steps below stay exactly the same no matter which category you fall into, only the data sources and dashboards you connect afterward change.
How Grafana Compares to Other Monitoring Tools
You might have heard of Kibana, Datadog, or New Relic, so let me quickly place Grafana among them before we move on to installation.
- Kibana is built specifically for Elasticsearch data and log analysis, while Grafana connects to dozens of different data sources and is not tied to one database.
- Datadog and New Relic are paid, fully hosted platforms that charge based on the hosts and data you send them, and the cost climbs fast as your infrastructure grows.
Grafana OSS, running on your own VPS, costs you only the price of the server itself.
You keep full control of your data, you are not locked into a vendor’s pricing tiers, and you scale it by simply upgrading your VPS plan instead of negotiating a new contract.
For teams that want real visibility without a recurring bill, a self hosted Grafana instance on an affordable VPS is one of the more practical choices available right now.
Why Take VPS From YouStable to Deploy Grafana?
Grafana needs a real server to live on, and picking the right VPS from day one saves you hours of frustration later, so let me tell you which one my team used for this guide.
My team ran this entire test on a YouStable VPS, and I am recommending it here for plain, practical reasons.
- YouStable gives you full root access on every VPS plan, which means you can install Grafana, its dependencies, and any additional monitoring stack you like without hitting a permission wall along the way.
- When you are stuck debugging a systemd service late at night, having an actual support agent answer your ticket instead of a chatbot saves the entire evening.
- You also get a free, easy to use control panel, a choice of operating systems including Ubuntu, Debian, AlmaLinux, and Rocky Linux.
- You even get one-click application installation for common software, and a choose-and-pay billing model with over 10 payment methods, including credit and debit cards, PayPal, UPI, net banking, and cryptocurrency.
- There are no hidden charges buried in the fine print.
For a monitoring server that needs to stay online around the clock, that mix of root access, uptime, and real support is exactly what you want underneath Grafana.
Getting Your VPS From YouStable
Here is how my team ordered the exact server used for this guide, in under five minutes.
- Go to the official YouStable VPS hosting page.

- Compare the available plans and pick one that matches your workload, a starter plan is more than enough to follow this tutorial >> Click Get Started on the plan you want
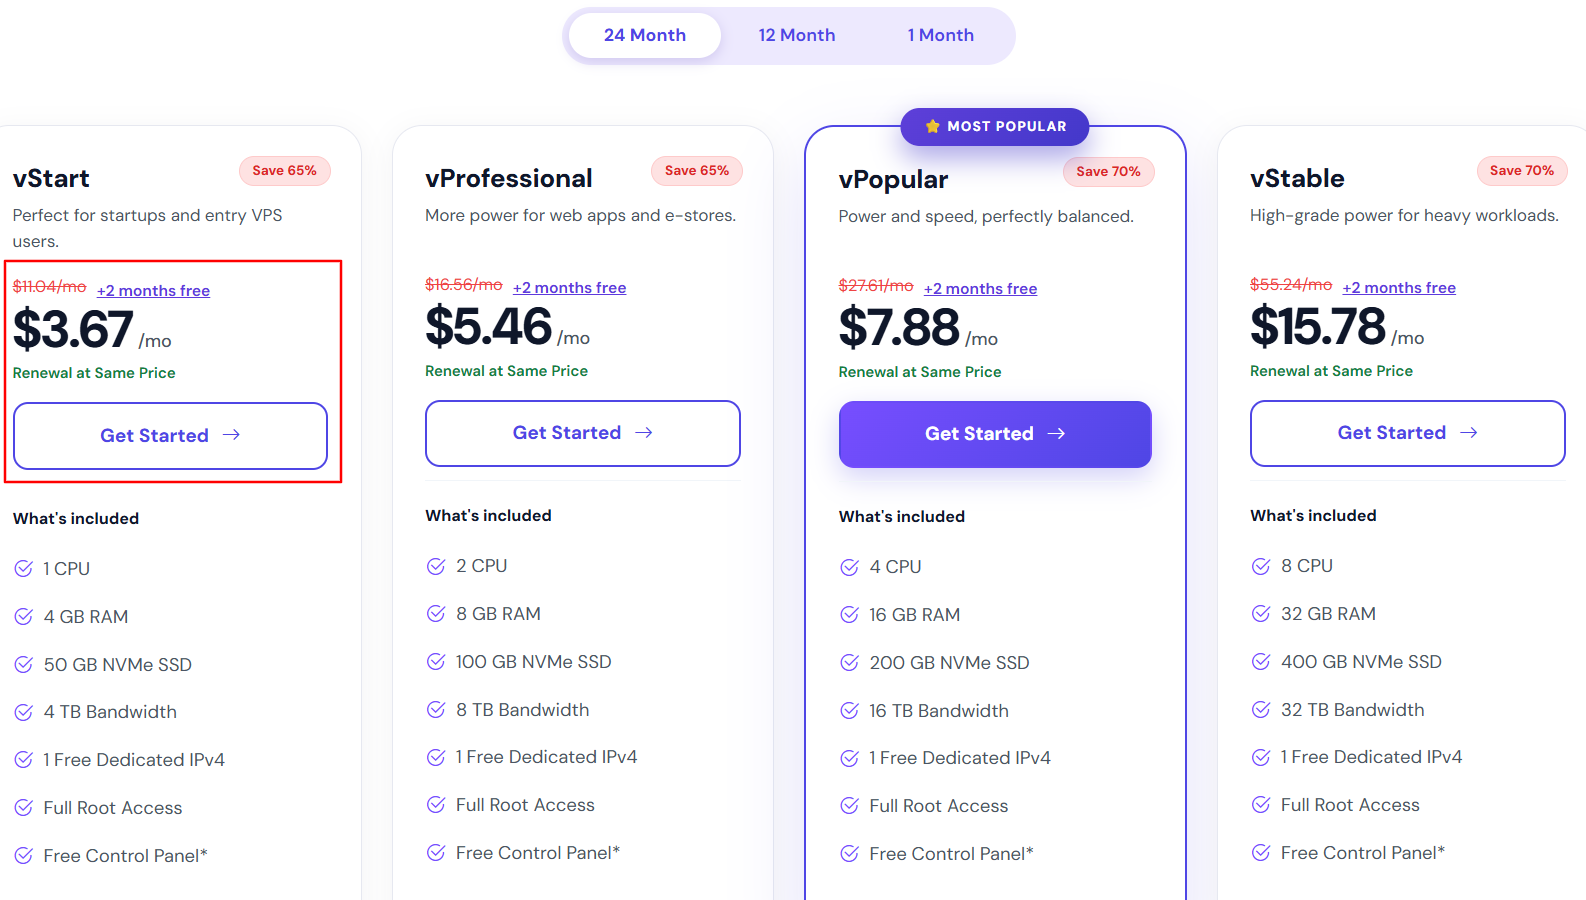
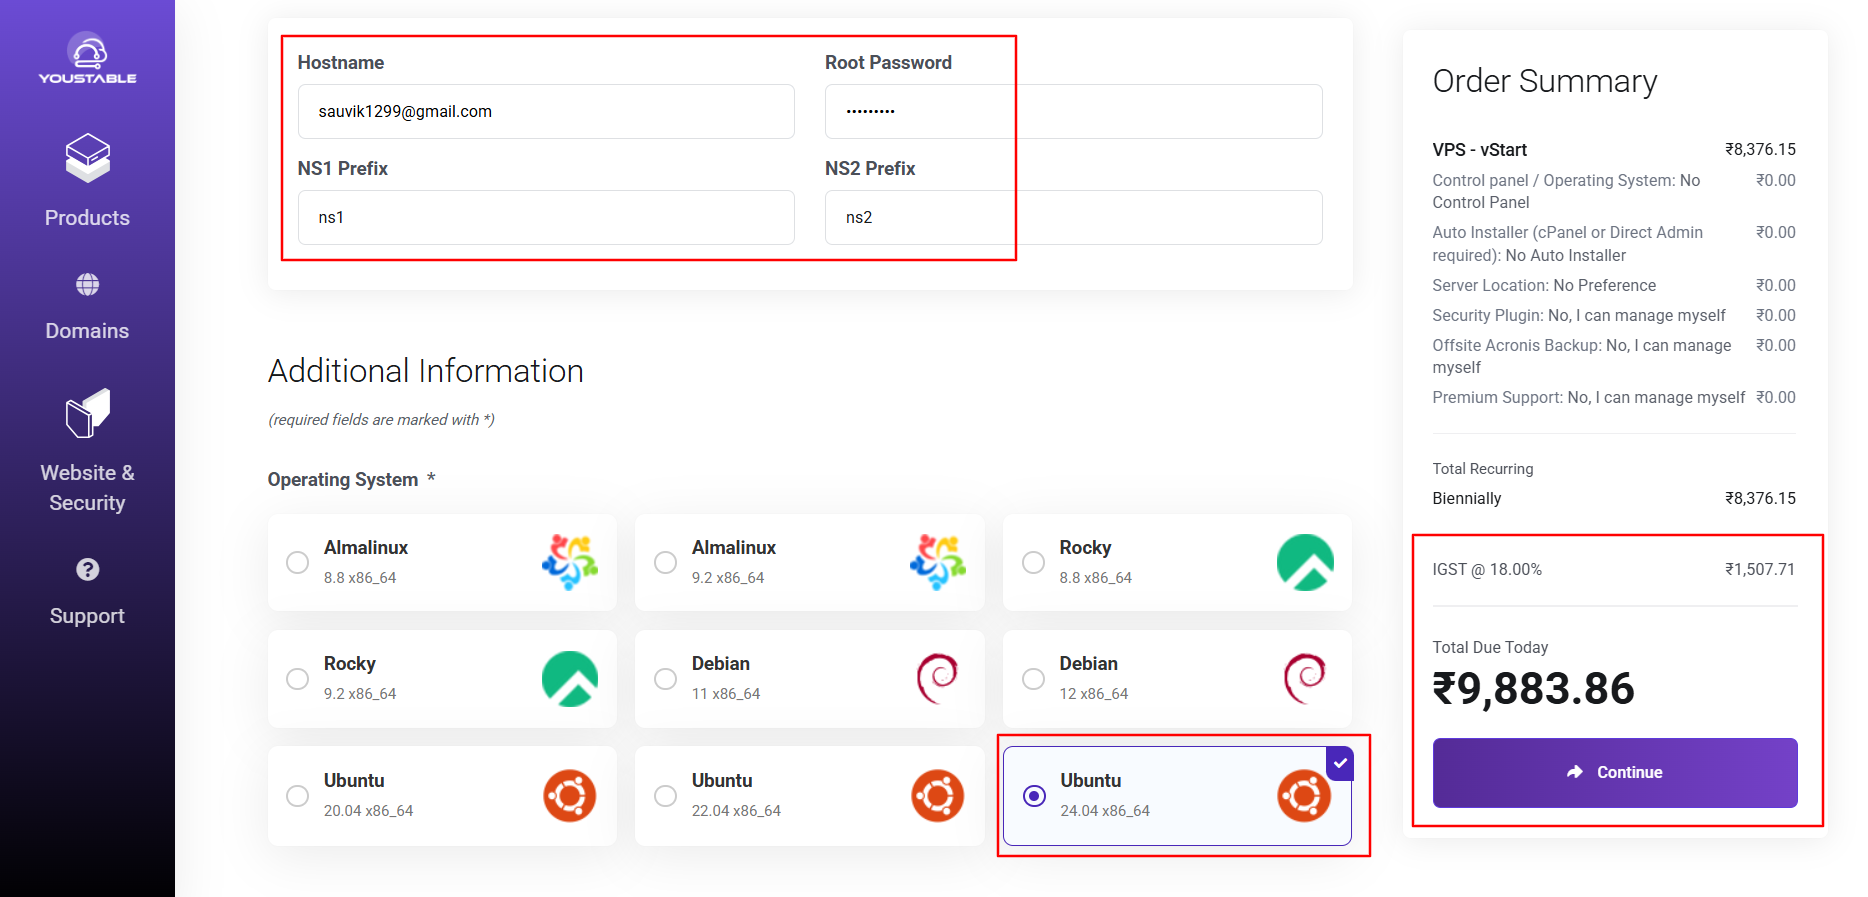
- Select Ubuntu 24.04 as your operating system on the configuration screen >> Fill in your billing details and choose a payment method
- Complete your payment >> Check your email, YouStable sends your VPS IP address, root username, and password within minutes of activation.
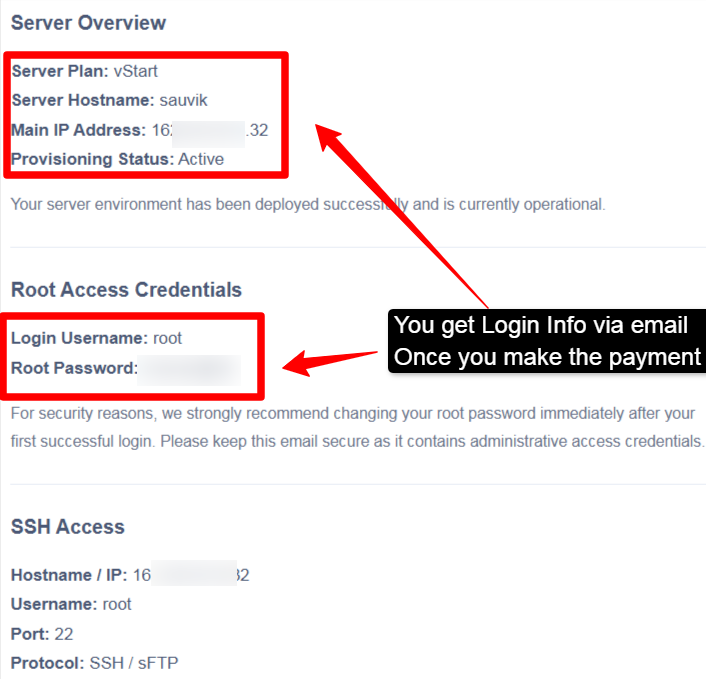
- Once you have those three details in hand, an IP address, a username, and a password, you are ready to move on to the installation steps below.
| Disclaimer: Pricing, plans, and features mentioned above reflect what was available on the YouStable website at the time my team tested this guide. Please check the official YouStable VPS hosting page for current pricing before you buy. |
What You Need Before Installing Grafana
With your VPS ready, there are a handful of things worth checking before you run a single Grafana command, and skipping this checklist is where most people get stuck later.
- You need SSH access to your VPS, which means an SSH client such as PuTTY on Windows, or the built-in Terminal app on macOS and Linux.
- You need root access or a user account with sudo privileges, which YouStable provides by default on every VPS plan.
- This guide is written for Ubuntu 24.04, though the same commands apply to Ubuntu 22.04 and Debian 11 or 12 with no changes beyond the GPG key step noted later.
- Your server needs at least 1 GB of RAM and a single CPU core to run a basic Grafana install comfortably.
- I recommend 2 GB of RAM in case you plan to run Prometheus or another data source on the same machine.
- You also need a stable internet connection on the VPS itself, so it can reach the Grafana package repository during installation.
My research team confirmed all of this on a 2 GB RAM, single core plan, and Grafana ran without any noticeable strain on the server.
Step 1: Connect to Your VPS and Update the System
Your checklist is complete, so let’s connect over SSH and bring the operating system fully up to date before touching Grafana itself.
Open your terminal and connect to your server using the IP address YouStable emailed you.
ssh root@your_server_ipEnter your password when prompted, and you are in. Now update your package list and upgrade any existing packages, so you are not installing Grafana on top of an outdated system.
apt update && apt upgrade -y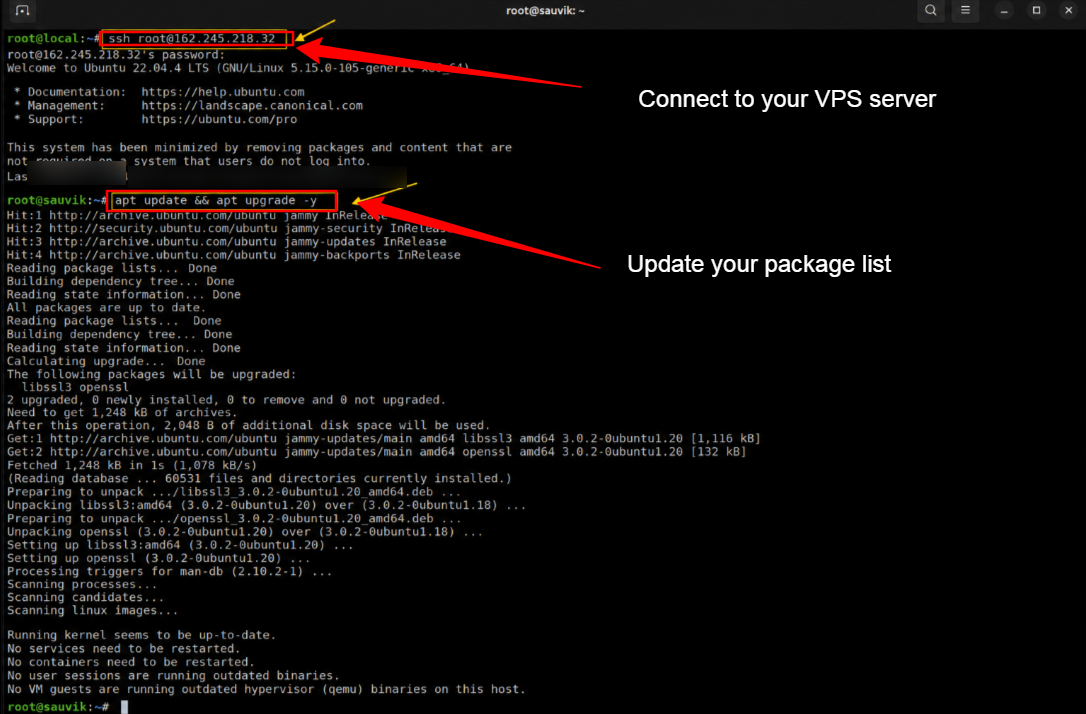
This step matters more than most people assume. My team has seen installations fail simply because a server had not been updated in months, leaving old library versions behind that conflict with newer packages.
Step 2: Install the Required Dependencies
Grafana relies on a small set of supporting tools to fetch and verify its packages, so let’s install those next before adding the repository.
Run this command to install the packages Grafana needs for secure repository access.
apt install -y apt-transport-https software-properties-common wget gnupg2These four packages let your server communicate with external repositories over HTTPS and confirm that anything it downloads is genuinely signed by Grafana Labs, not a tampered file from somewhere else.
Step 3: Add the Grafana GPG Key and Repository
This is the step where people most often make a small mistake, so follow it command by command exactly as written below.
First, create a folder to store the signing key.
mkdir -p /etc/apt/keyrings/Now download the official Grafana GPG key and convert it into a format APT can read.
wget -q -O - https://apt.grafana.com/gpg.key | gpg --dearmor | tee /etc/apt/keyrings/grafana.gpg > /dev/nullNext, add the Grafana repository to your system’s list of sources.
echo "deb [signed-by=/etc/apt/keyrings/grafana.gpg] https://apt.grafana.com stable main" | tee -a /etc/apt/sources.list.d/grafana.listFinally, refresh your package index so the system recognizes the new repository.
apt update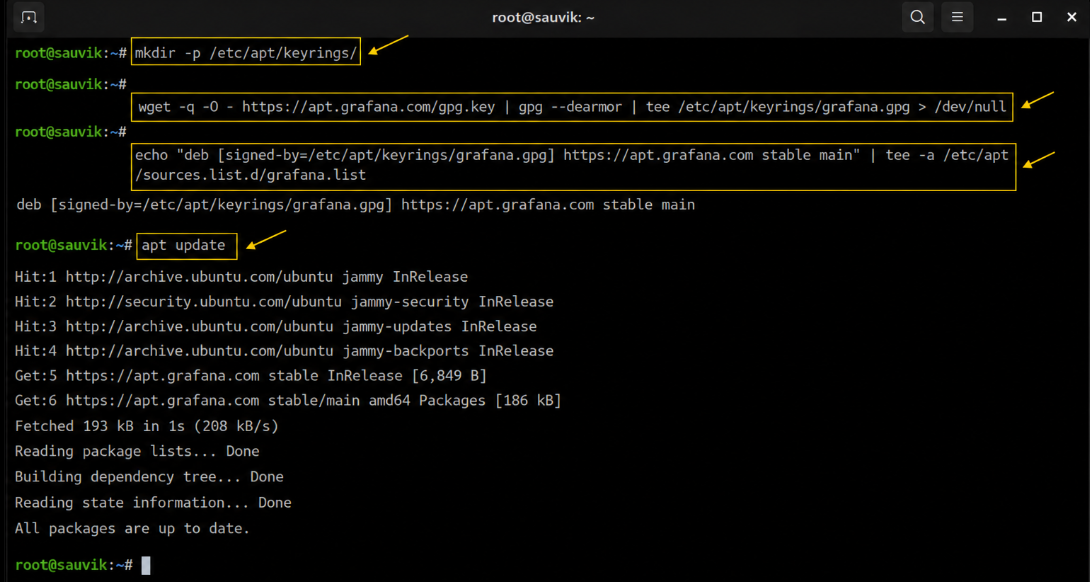
Writer’s Note: My team ran into one recurring error at this exact step during testing, an outdated GPG key format on an older server image. Recreating the key using the dearmor method shown above cleared the error every single time we hit it.
Step 4: Install Grafana on Your VPS
With the repository added and recognized, installing Grafana itself now takes a single short command.
apt install grafana -yGive it a minute to download and configure.
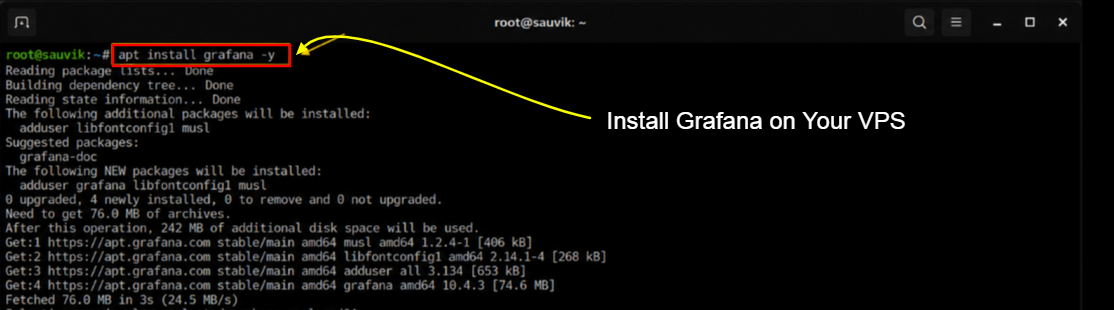
Once it finishes, Grafana is sitting on your server, though it is not running yet, so do not open your browser just yet.
Step 5: Start and Enable the Grafana Service
Installing Grafana and running Grafana are two separate things, so let’s start the service and make sure it survives a server reboot.
- Reload systemd so it recognizes the new Grafana service file.
systemctl daemon-reload- Start the Grafana service.
systemctl start grafana-server- Enable it, so it starts automatically every time your VPS reboots.
systemctl enable grafana-server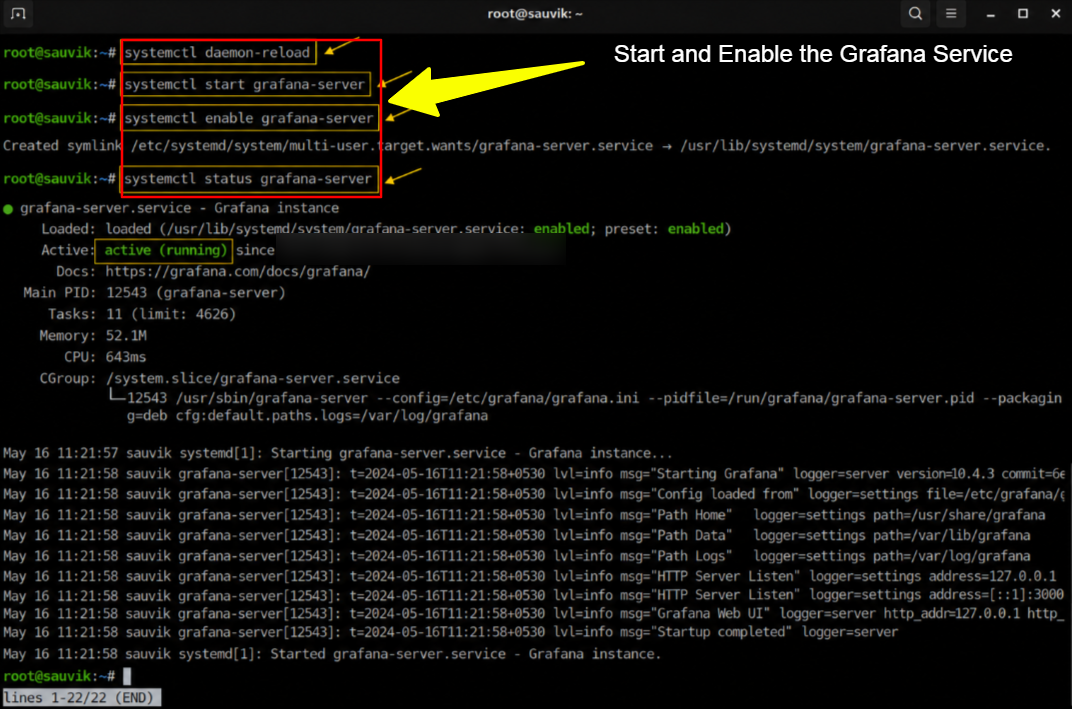
- Check that it is running correctly.
systemctl status grafana-serverYou should see “active (running)” on your screen. That single line confirms Grafana is live on your server and ready for the next step.
Step 6: Open the Firewall Port for Grafana
Grafana runs on port 3000 by default, and your firewall needs to allow that traffic through before you can reach it from a browser.
On Ubuntu, UFW is the default firewall. Run these three commands to open the correct ports.
ufw allow 3000/tcpufw allow OpenSSHufw enable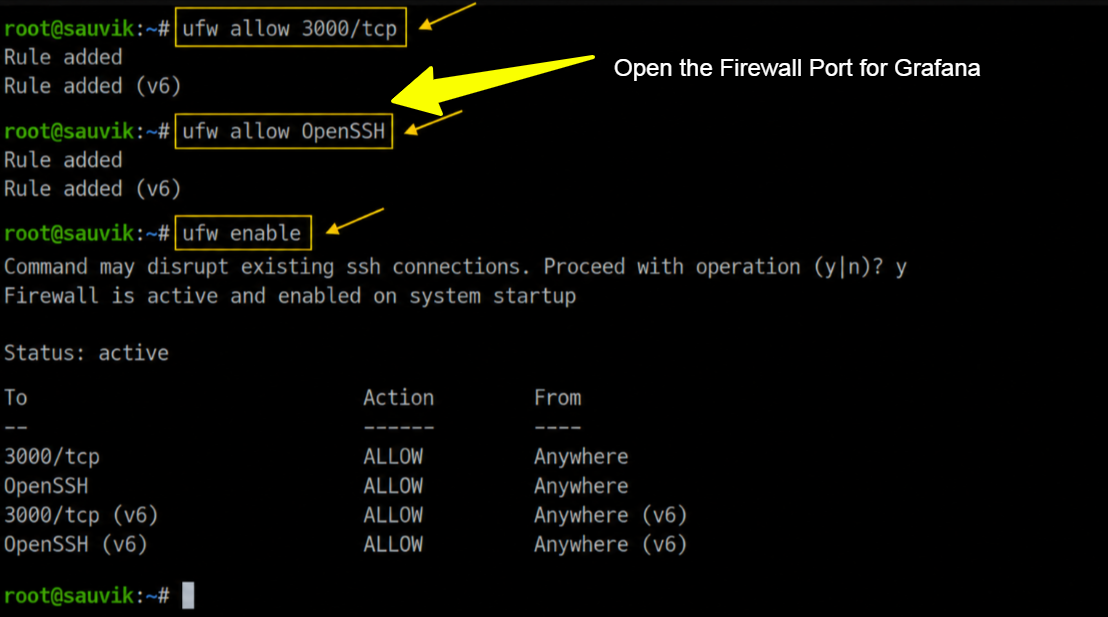
Type (y) and press enter when asked to confirm. Skip this step only in case your VPS provider manages firewall rules through a separate control panel, and open port 3000 there instead.
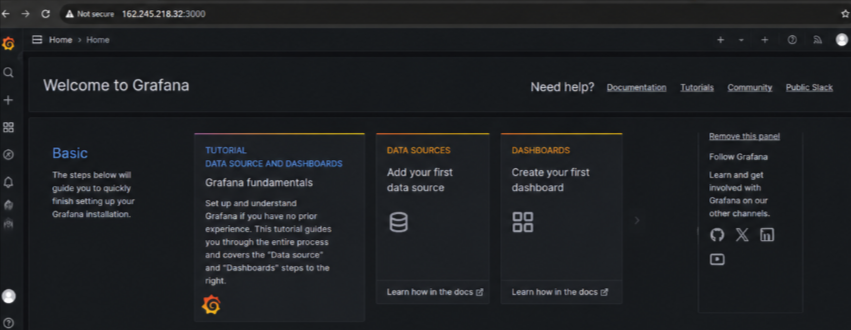
Step 7: Log Into Grafana for the First Time
Your Grafana service is running and the port is open, so now let’s actually see the dashboard inside your browser.
- Open a browser and go to your server’s IP address followed by port 3000, exactly like this.
http://your_server_ip:3000- You will land on the Grafana login screen >> Enter admin as both the username and the password.
- Grafana immediately asks you to set a new password >> Choose something strong. My team always generates one through a password manager >> then click submit.
You are now looking at your own Grafana dashboard for the first time.
Step 8: Secure Your Grafana Installation
A freshly installed Grafana dashboard is not fully locked down by default, so let’s close a couple of gaps before connecting any real data.
- Open the Grafana configuration file.
nano /etc/grafana/grafana.ini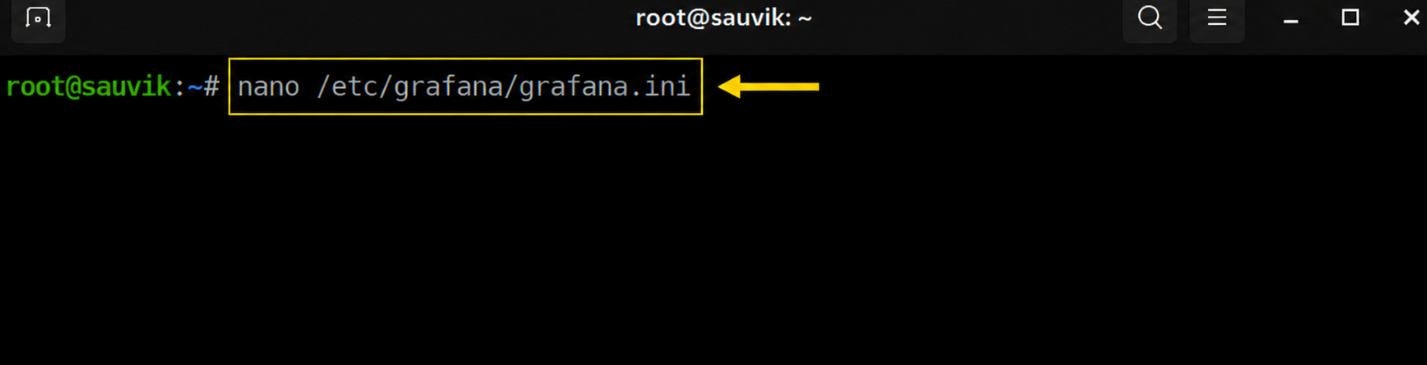
- Find the [auth.anonymous] section and confirm enabled is set to false, so nobody can view your dashboards without logging in first.
- Find the [users] section and set allow_sign_up to false, so strangers cannot create accounts on your own instance.
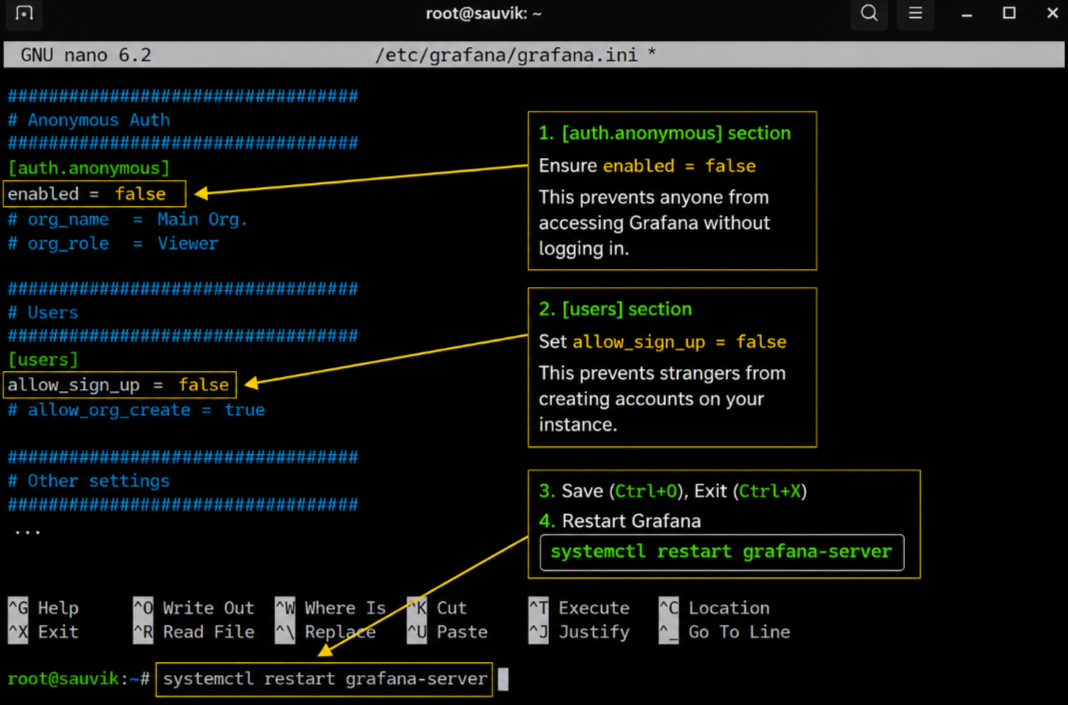
- Save the file, exit nano, and restart Grafana for the changes to take effect.
systemctl restart grafana-serverWriter’s Note: I always complete this security step immediately after the first login, before adding a single data source. An exposed monitoring dashboard reveals far more about your infrastructure than most people realize, right down to server names and internal metrics.
Step 9: Put Grafana Behind Nginx and a Free SSL Certificate
Running Grafana on a raw IP address and port works fine for quick testing, but a real domain name with HTTPS makes it genuinely production ready.
- Install Nginx first.
apt install nginx -y- Create a new site configuration file.
nano /etc/nginx/sites-available/grafana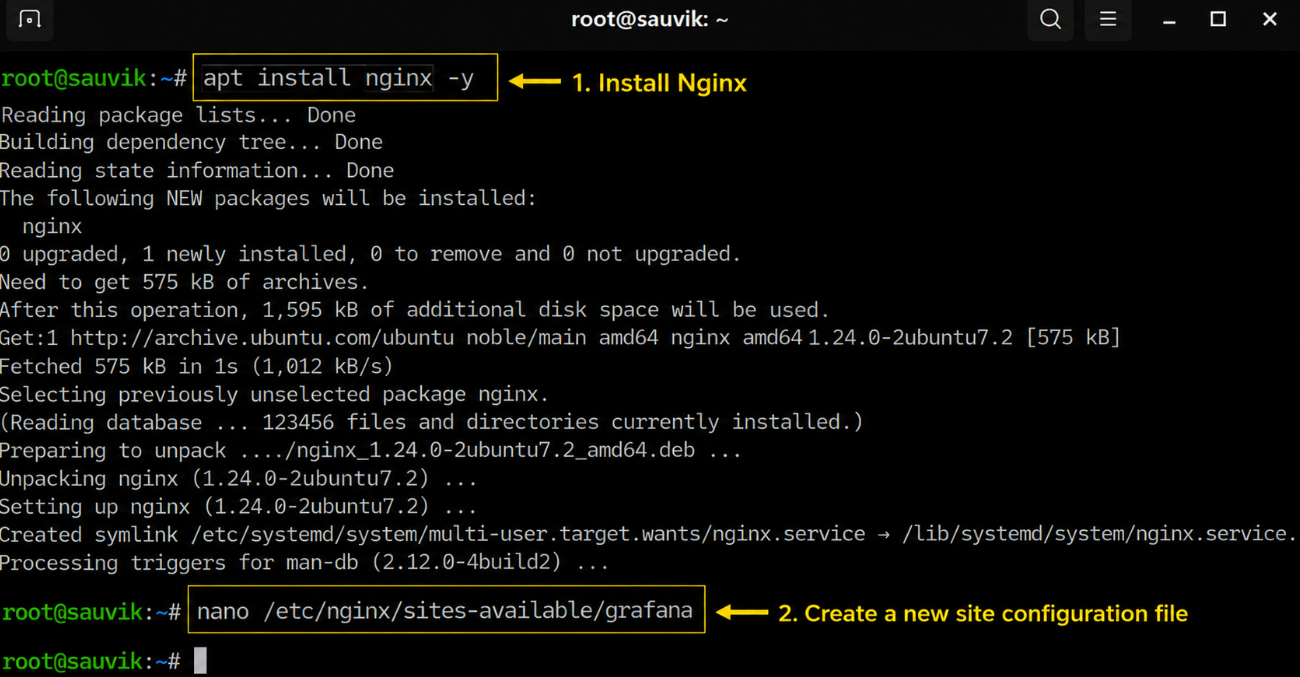
- Paste the configuration below, replacing grafana.yourdomain.com with your own domain name.
server {    listen 80;    server_name grafana.yourdomain.com;
location / { proxy_pass http://localhost:3000/; proxy_set_header Host $host; }}- Enable the new site and restart Nginx.
ln -s /etc/nginx/sites-available/grafana /etc/nginx/sites-enabled/nginx -tsystemctl restart nginx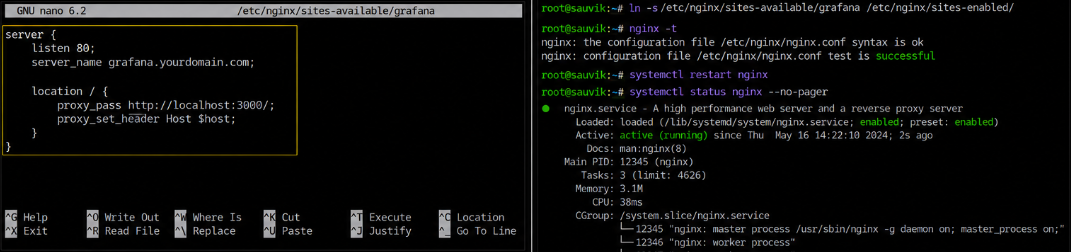
- Now install Certbot and generate a free SSL certificate for your domain.
apt install certbot python3-certbot-nginx -ycertbot --nginx -d grafana.yourdomain.com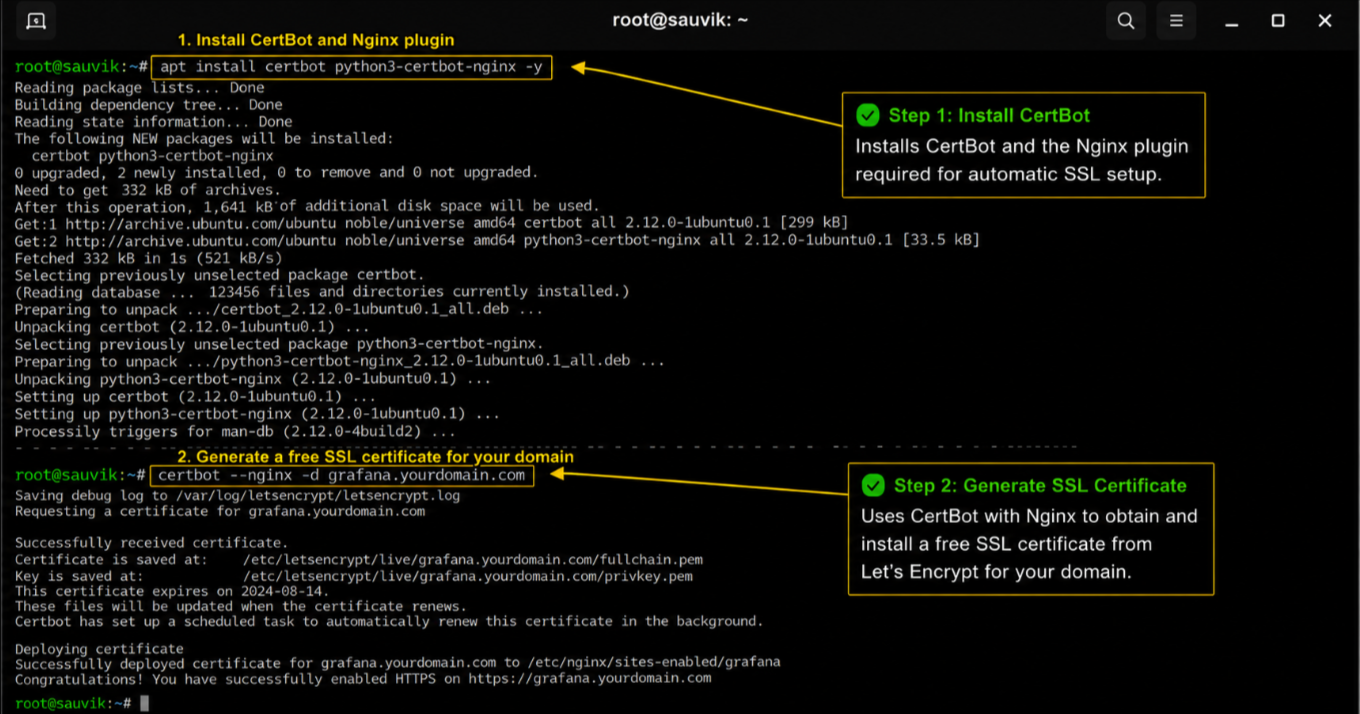
- Follow the on screen prompts, and Certbot handles both the certificate and the Nginx configuration update automatically.
- Your Grafana dashboard is now reachable at a proper domain name over HTTPS, instead of a bare IP address and port number that is harder to remember and less trustworthy for anyone else who needs access.
Step 10: Connect Your First Data Source and Build a Dashboard
A dashboard with nothing connected to it is just an empty screen, so let’s link Grafana to a real source of data.
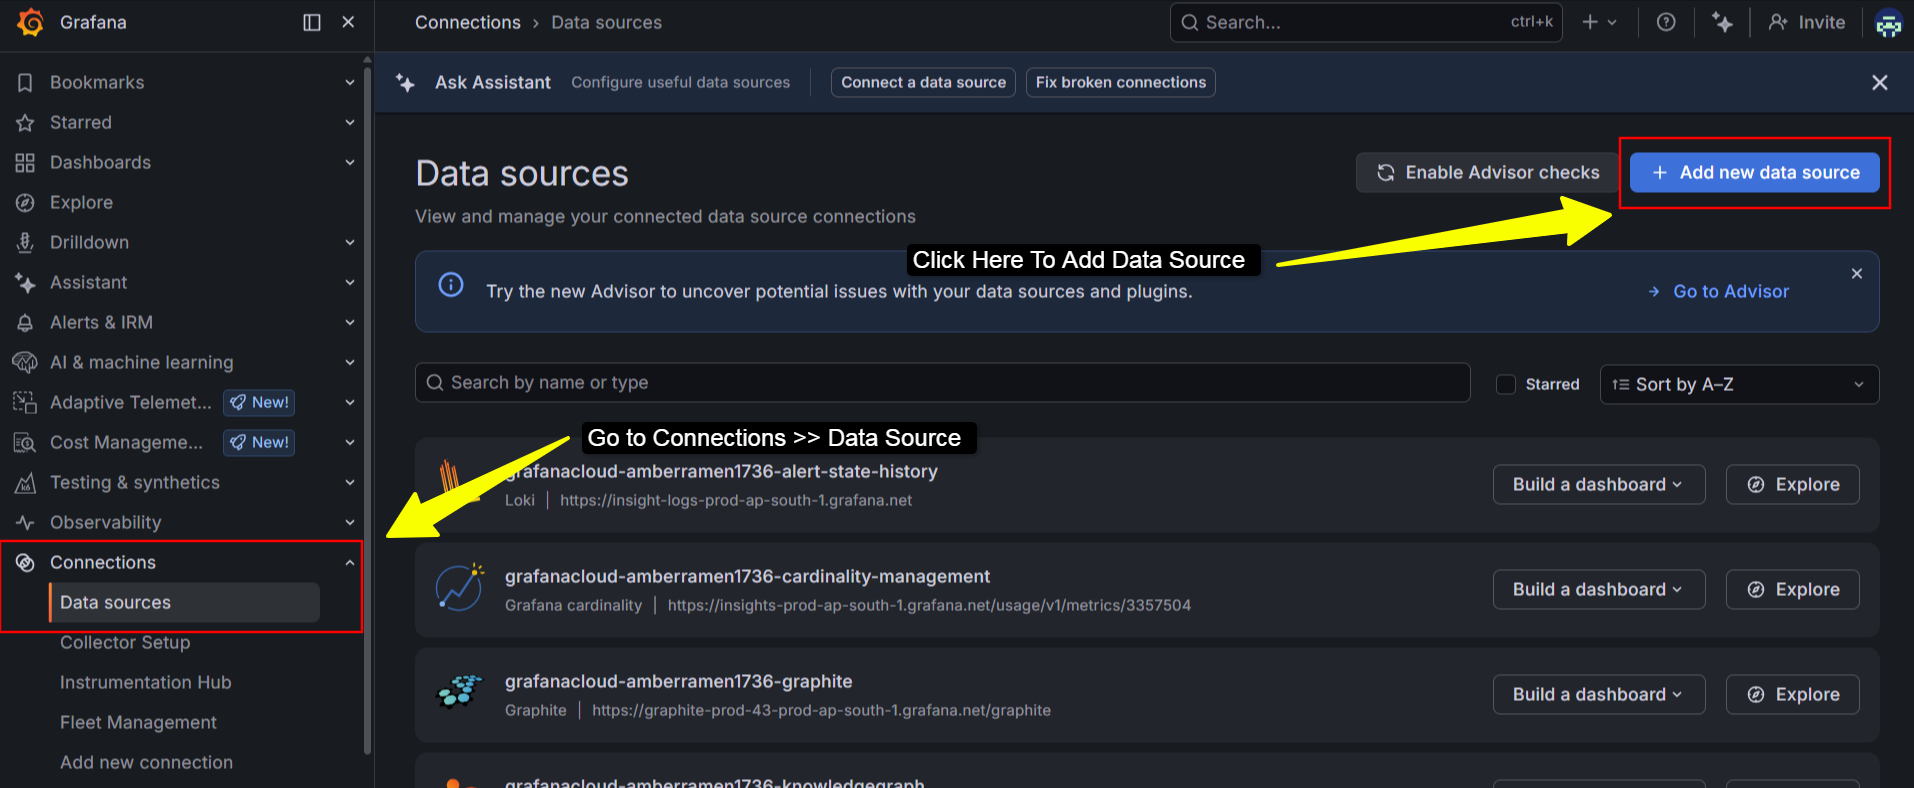
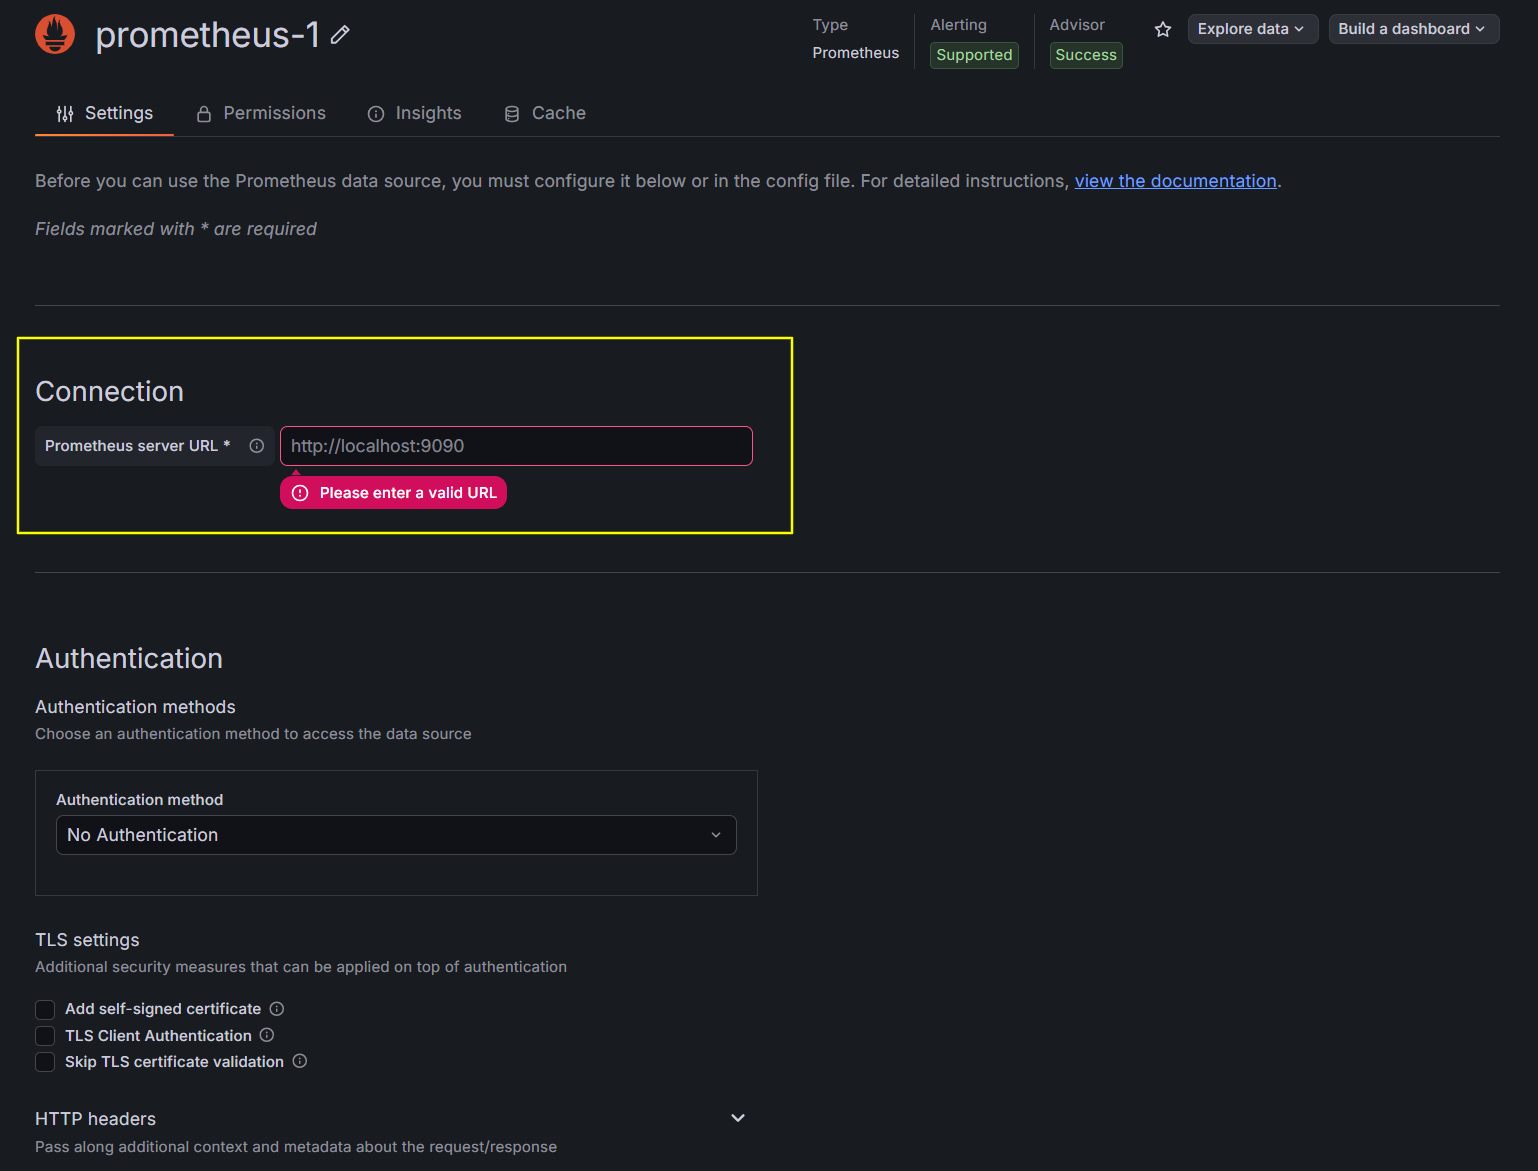
- Inside Grafana, click Connections in the left hand menu, then Data Sources, then Add data source.
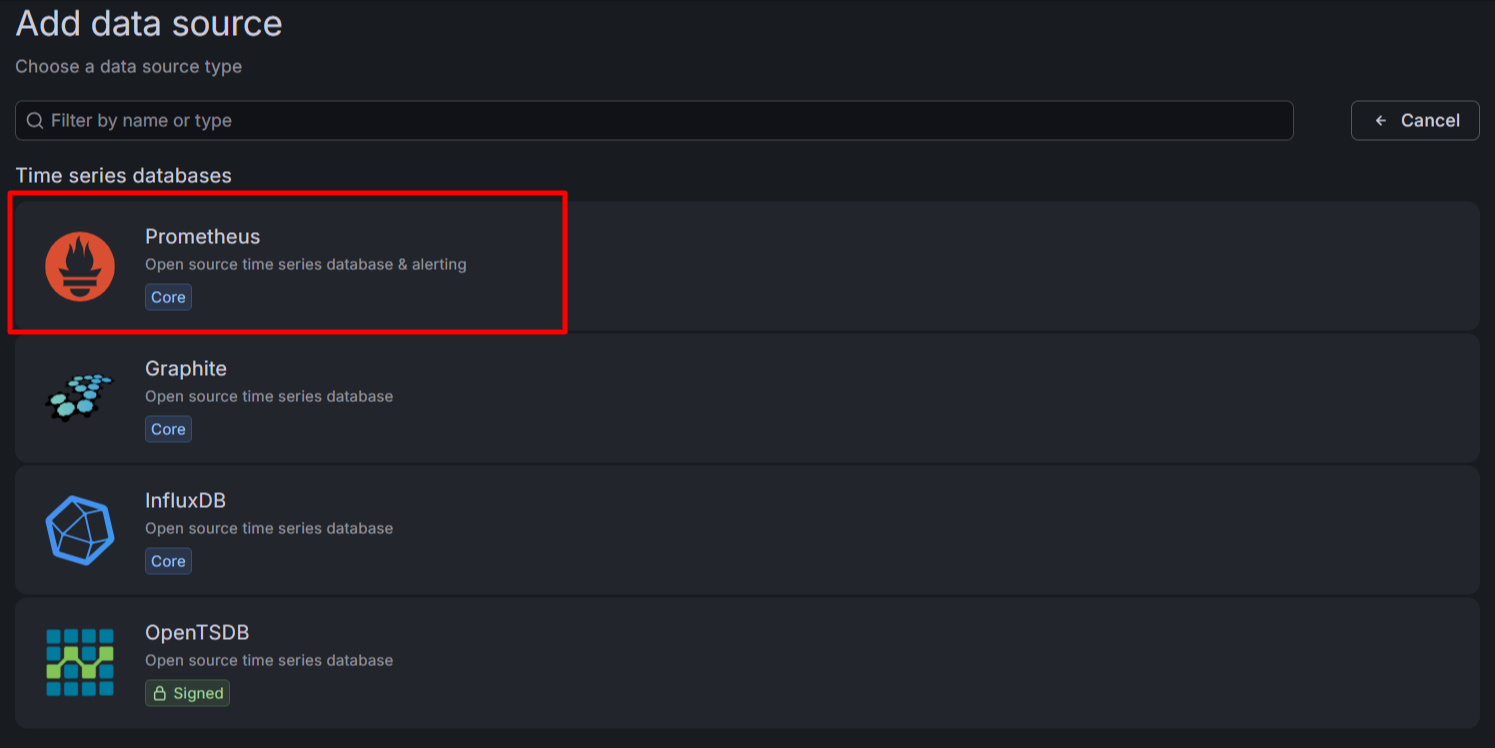
- Pick whichever source your setup actually uses. Common choices include Prometheus for server and infrastructure metrics, MySQL or PostgreSQL for application and business data, or Loki for centralized log collection.
- Enter the connection details for your chosen source and click Save and Test. Grafana confirms the connection immediately on the same screen.
- From here, you can build a dashboard panel by panel using Grafana’s built in editor, or save time by importing a ready made dashboard from the public Grafana dashboard library using its ID number under Dashboards, then Import.
- My team almost always starts with an imported dashboard and customizes it afterward, since it saves significant setup time compared to building every panel from scratch.
Once a dashboard looks the way you want, you can share it with teammates by inviting them as Grafana users with viewer or editor permissions.
Or you can even export the dashboard as a JSON file so you can version it alongside your other infrastructure configuration and reuse it across multiple servers.
Setting Up Your First Alert in Grafana
A dashboard tells you what happened, but an alert tells you the moment something goes wrong, so let’s set one up before wrapping up.
- Click Alerting in the left menu, then Alert rules, then New alert rule.
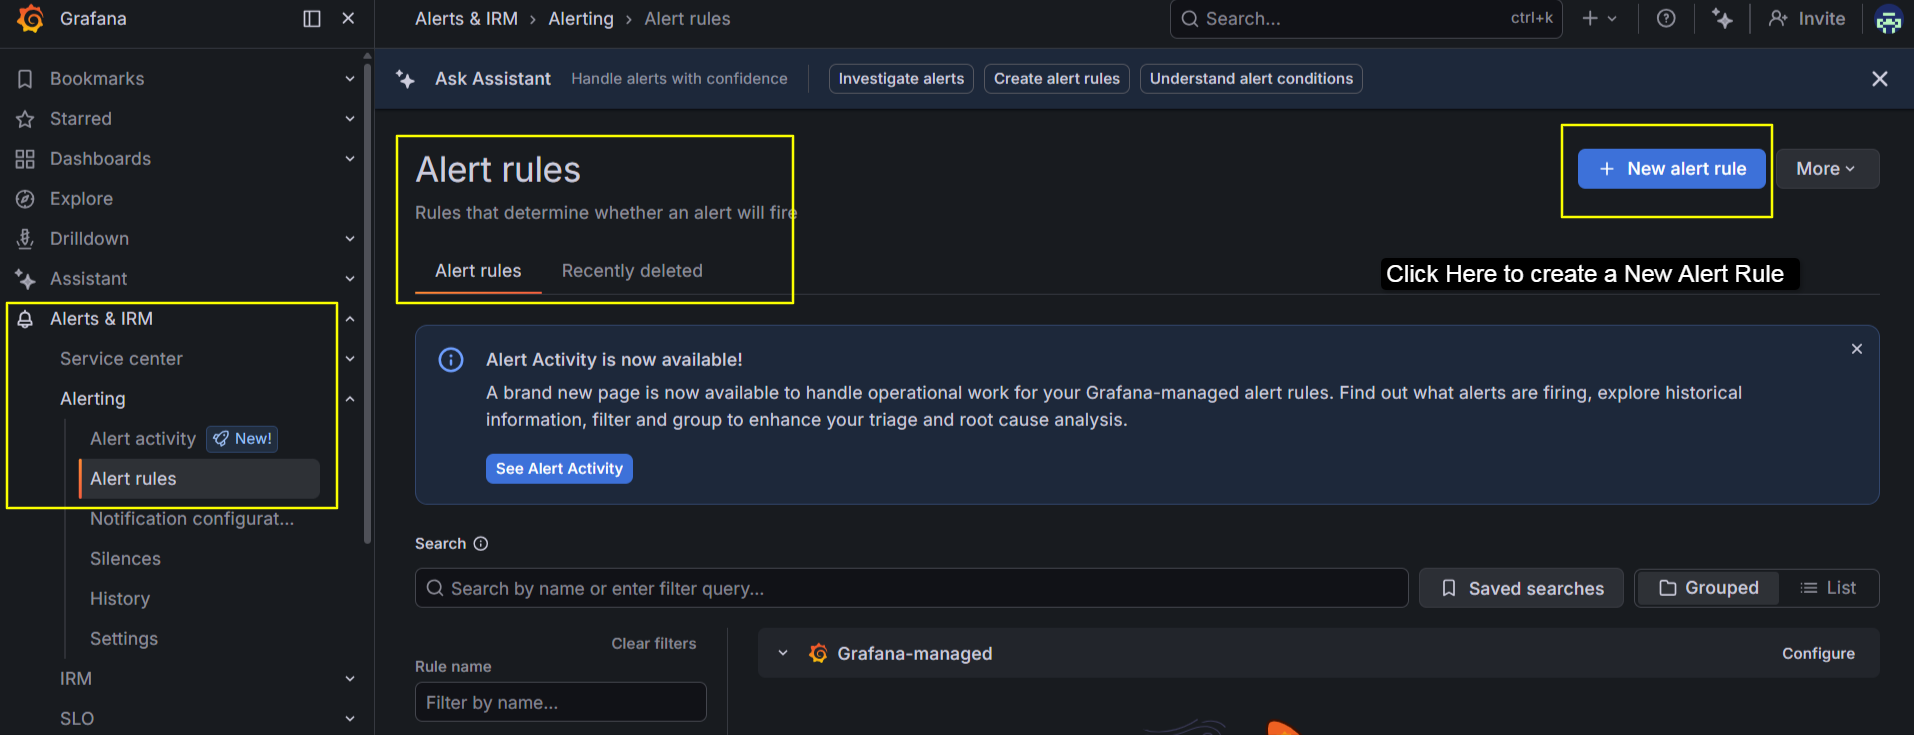
- Choose the data source and metric you want to watch, set the condition that should trigger the alert, such as CPU usage staying above 90 percent for five minutes, then save the rule.
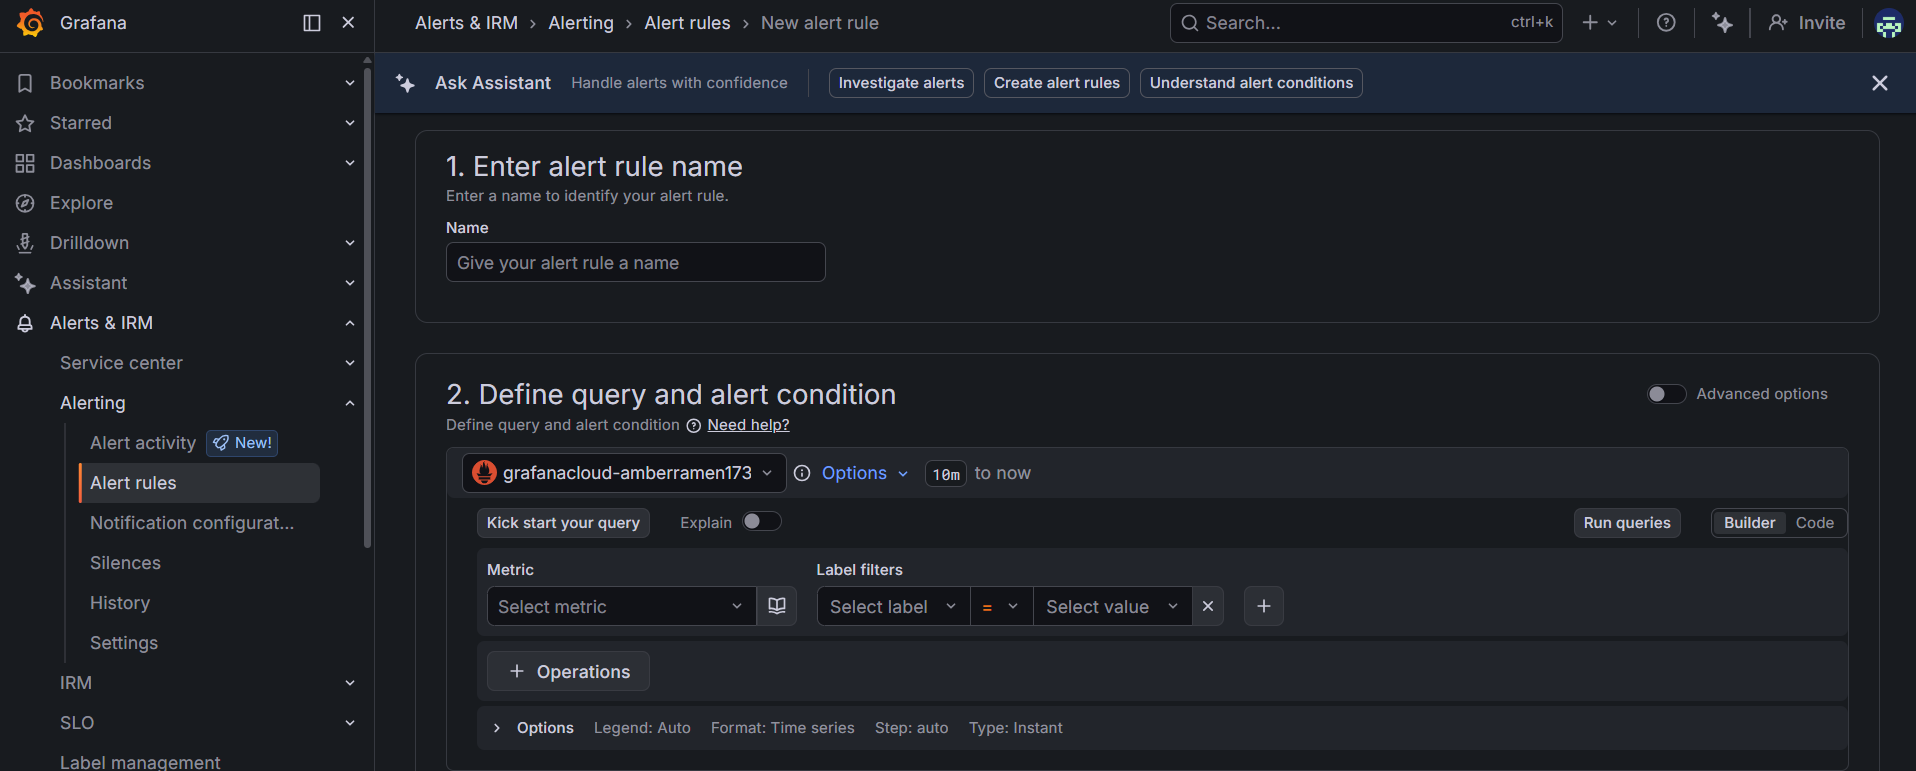
- Next, go to Contact points and add where you want the alert delivered, common options include email, Slack, or a webhook URL.
- Finally, check Notification policies to confirm your new alert routes to the correct contact point.
Once saved, Grafana watches that metric continuously and notifies you the moment the condition is met, without you needing to check the dashboard yourself.
Mistakes My Team Sees Most Often
Before you go build out your dashboards, here are the mistakes my research team keeps running into during this exact setup, so you can skip them entirely.
- Skipping the firewall step is the most common one. People finish the installation, open their browser, get nothing, and assume Grafana is broken, when the actual cause is a closed port 3000.
- Leaving anonymous access and public sign up enabled comes next. It feels harmless during testing, then quietly stays enabled in production, exposing internal server metrics to anyone who stumbles onto the link.
- Forgetting the enable command after starting the service is another one. Grafana runs fine that day, then a routine reboot a week later silently kills the dashboard, and nobody notices until someone goes looking for it.
- Choosing a VPS with too little RAM causes a different kind of problem. Grafana itself is light, but people blame it for lag when the actual cause is an underrated server struggling to run the underlying data source alongside it.
- Never changing the default admin password past the first login screen rounds out the list. It takes ten seconds to fix and gets skipped constantly, leaving a predictable admin and password combination running your monitoring stack.
If you avoid these five mistakes, it puts your setup ahead of most self hosted Grafana installations my team has reviewed over the years.
How My Team Tested This Guide
My research team ran every single command in this article on a fresh YouStable VPS running Ubuntu 24.04, start to finish, on three separate days, using three separate fresh server instances, to confirm nothing here depends on a lucky starting state.
| We hit exactly one issue during testing, an outdated cached GPG key on an older server image, and the fix for that is already built into Step 3 above. |
Outside of that single case, every command ran clean on the first attempt, which is the bar I hold every guide I publish to.
Please Note: Software changes over time. Grafana version numbers, package names, and default file paths mentioned in this guide reflect the most current stable release available at the time of testing. Always check the official Grafana documentation in case a newer major version changes a specific command.
FAQs
What is Grafana used for?
Grafana turns metrics, logs, and traces from tools like Prometheus, MySQL, and Loki into dashboards and alerts, so teams can watch server health, application performance, and business data on one screen instead of checking several separate tools throughout the day.
Do I need a powerful VPS to run Grafana?
No. A VPS with 1 to 2 GB of RAM and a single CPU core runs Grafana comfortably on its own. You only need more resources in case you also run a heavier data source, such as Prometheus, on that same server.
Is Grafana free to use?
Yes. Grafana OSS, the version this guide installs, is completely free and open source. Grafana Labs also sells an Enterprise edition with additional plugins and dedicated support, but it is not required for most self hosted setups like the one covered here.
Why is my Grafana dashboard not loading in the browser?
This almost always means port 3000 is blocked somewhere. Check your VPS firewall with the ufw status command, confirm port 3000 is allowed. Even confirm the Grafana service itself is active using systemctl status grafana-server.
Can I use a domain name instead of an IP address for Grafana?
Yes. Point your domain’s A record to your VPS IP address, then set up Nginx as a reverse proxy along with a free SSL certificate through Certbot.
How do I reset my Grafana admin password in case I forget it?
Connect to your VPS through SSH, then run grafana-cli admin reset-admin-password followed by your new password, and restart the Grafana service afterward for the change to take effect.
Can Grafana monitor more than one server at once?
Yes. Install a metrics exporter, such as node_exporter, on each server you want to monitor, point a single Prometheus instance at all of them, then connect that one Prometheus instance to your central Grafana dashboard.
Which VPS should I use for Grafana?
Any VPS with SSH access and root privileges works for this setup. You can use YouStable VPS for Grafana because of the full root access, NVMe storage, 99.99% uptime guarantee, and 24/7 support at a genuinely affordable monthly price.
Does installing Grafana affect my server’s other applications?
No, in most cases. Grafana runs as its own independent service on port 3000 and does not interfere with a web server, database, or application already running on the same VPS, as long as the server has enough spare RAM and CPU to run both comfortably.
How do I update Grafana once it is installed?
Because you installed Grafana through the official APT repository, updating it is simple. Run apt update followed by apt upgrade grafana, then restart the service with systemctl restart grafana-server. Your dashboards and settings stay exactly as they were before the update.
Final Thoughts
You now have a fully working, password protected Grafana dashboard running on your own VPS, connected to a real data source, and reachable through a proper domain name in case you completed Step 9.
My team tested every command in this guide from a blank server, so you would not have to troubleshoot alone at any point.
In case you are still choosing a server for this project, start with a YouStable VPS plan, since that is exactly what powered every single command shown above.
| Disclaimer: Always review the official Grafana documentation and your VPS provider’s terms of service before making changes to a live production server. |