The top command in Linux is a real time process monitor that displays CPU, memory, load average, and per-process usage. It helps you find resource hungry tasks, sort by CPU or memory, kill or renice processes, and troubleshoot performance issues.
Use top for live monitoring, or batch mode to log snapshots for later analysis. If you manage servers or develop on Linux, learning the top command is essential.
This guide explains the top command in Linux with examples, shortcuts, and practical workflows used in production environments, so you can quickly diagnose high CPU, memory leaks, load spikes, and slow applications.
What is the Top Command in Linux?
The Linux top command shows a live, continuously updating view of system performance.
It lists running processes and key metrics like CPU, memory, swap, and system load. You can sort, filter, kill, or renice processes directly within the interface. It’s installed by default on most distributions (Ubuntu, Debian, CentOS, Rocky, Fedora).
How to Read Top Output (Header Breakdown)
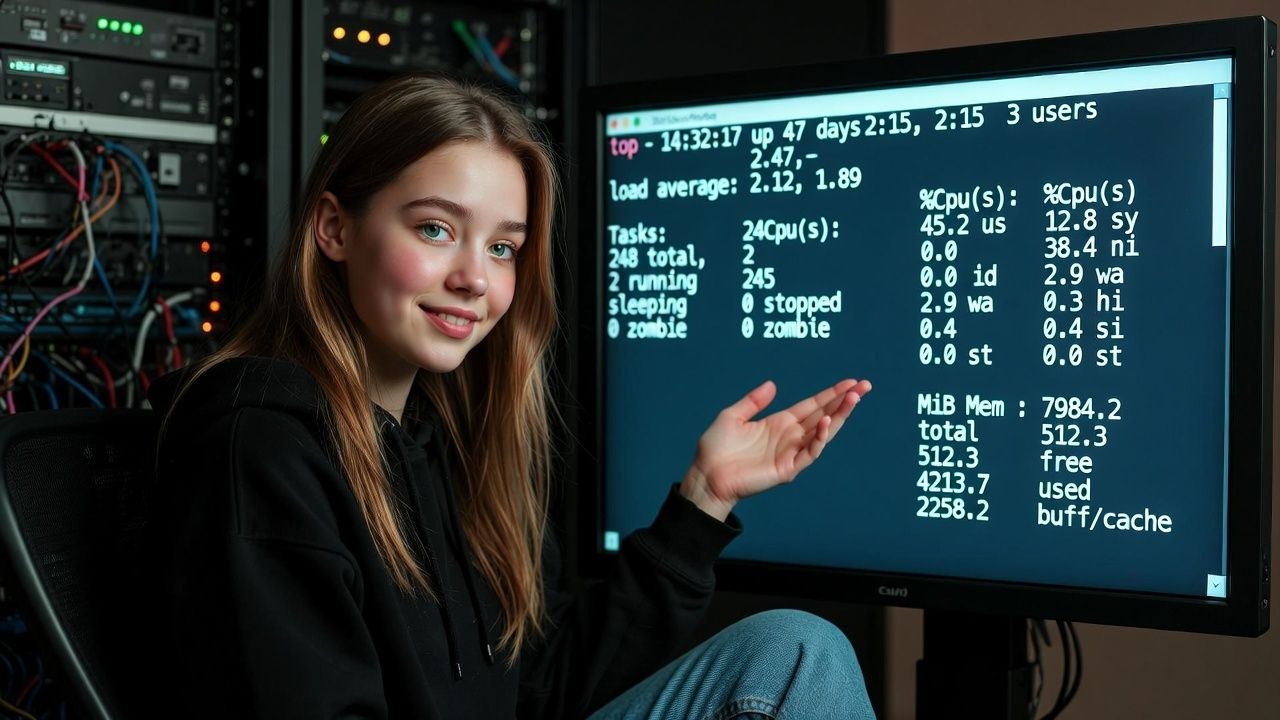
When you run top, you’ll first see the summary header, then the process list. Understanding the header saves time and helps you act confidently.
Uptime and Load Average
The first line shows current time, how long the system has been up, logged in users, and load average over 1, 5, and 15 minutes. Load average roughly represents runnable processes. On a 4-core CPU, a sustained load of 4.00 means full utilization.
Rule of thumb: If the 15 minute load average consistently exceeds your CPU core count, investigate CPU, I/O wait, or lock contention.
Tasks and Process States
The tasks line shows the number of processes and their states: running, sleeping, stopped, and zombie. Many zombies indicate improper child process handling. Many sleeping tasks are normal on servers.
CPU Utilization
The CPU line breaks down usage by type: us (user), sy (system), ni (nice), id (idle), wa (I/O wait), hi/si (hardware/software interrupts), st (steal in virtualized environments). High wa suggests disk or network bottlenecks; high st indicates host level contention in VPS environments.
Memory and Swap
Memory lines show total, used, free, and buffers/cache. On modern Linux, “used” includes page cache; focus on available memory. Frequent swap in/out plus high wa means memory pressure. If swap is heavily used, find memory hungry processes or leaks.
Key Process Columns Explained
By default, top shows these important columns:
- PID/USER: Process ID and owner.
- PR/NI: Priority and nice value (lower PR runs first; higher NI means “nicer,” i.e., lower priority).
- VIRT/RES/SHR: Virtual, resident, and shared memory.
- S: Process state (R running, S sleeping, D uninterruptible, T stopped, Z zombie).
- %CPU/%MEM: CPU and memory share per process.
- TIME+: Cumulative CPU time used.
- COMMAND: Process name or full command line (toggle with c).
Basic Usage: Top Command Examples
Launch Top and Update Interval
top
top -d 1      # refresh every 1 second
top -d 0.5    # faster refresh (may increase CPU usage)
Use -d to control delay between updates. For servers, 1–3 seconds is usually sufficient.
Sort by CPU or Memory
Interactively press P to sort by %CPU, M for %MEM, N for PID, or T for TIME+. You can toggle reverse order with R.
# Start top sorted by memory (procps-ng supports -o)
top -o %MEM

# Start top sorted by CPU
top -o %CPU
Show Per-CPU/Core Usage
Press 1 to toggle per-core CPU lines. This helps identify single threaded bottlenecks when one core is saturated while total CPU looks fine.
Filter by User or PID
# Only show processes for a specific user
top -u ubuntu

# Monitor selected PIDs only
top -p 1234,2345,3456
This is handy on multi tenant servers, CI runners, or application hosts with multiple services.
Show Threads and Full Commands
# Show threads for each process
top -H

# Toggle full command line while running top
c
Thread view (-H) is useful for debugging multi threaded apps (e.g., Java, Nginx worker threads, PHP-FPM pools).
Kill or Renice a Process from Top
Act carefully on production servers. Try graceful signals first.
# Inside top:
k            # kill prompt
1234         # enter PID
15           # SIGTERM (try first). Use 9 for SIGKILL if it won't exit.

r            # renice prompt
1234         # PID
10           # new nice value (higher = lower priority)
Batch Mode for Logging and Automation
Batch mode doesn’t require a terminal and is perfect for scripts or cron jobs.
# One snapshot
top -b -n 1 > /tmp/top-snapshot.txt

# 5 snapshots, 2 seconds apart
top -b -d 2 -n 5 | tee /tmp/top-log.txt
Reduce Noise and Enable Color
# Ignore idle/zombie processes
i

# Toggle color/mono (if supported)
z
Press h or ? inside top to view help and all available interactive commands on your system.
Interactive Shortcuts You’ll Use Daily
- P / M / N / T: Sort by CPU, memory, PID, or time.
- R: Reverse sort order.
- 1: Toggle per-core CPU view.
- c: Show full command line.
- i: Hide idle processes.
- k: Kill; r: Renice.
- f: Field manager; use s inside to set sort field, space to toggle columns, Enter to apply.
- z: Color mode; b: bold/bright (varies by build).
- t / m: Toggle CPU and memory summary styles.
- h or ?: Help; q: Quit.
Real World Troubleshooting with Top (Scenarios)
- High CPU on web server: Press P to sort by CPU. Press 1 to check a single core pinned at 100%. If PHP-FPM or a Java thread dominates, capture a stack trace or temporarily renice; investigate application hot paths.
- Memory leak suspicion: Press M to sort by %MEM; watch RES column over time. Use top -H to see thread level behavior. Correlate with swap usage and OOM events in dmesg or system logs.
- Load average spikes: Compare us/sy/wa fields. High wa suggests disk/db latency; investigate with iostat, iotop, or database slow logs.
- Zombie processes: Check the Tasks line. Persistent Z state implies a parent not reaping children, inspect parent process and application code.
- Multi tenant VPS: Run top -u user or top -p with specific PIDs to focus on a client or service. Use batch mode to create incident timelines during traffic surges.
Interpreting Metrics and When to Act
- Load average: Investigate if 15‑minute load > core count for sustained periods.
- CPU us vs sy: High sy (kernel time) may indicate heavy networking, system calls, or context switching.
- I/O wait (wa): >10–20% sustained is a red flag for storage bottlenecks.
- Memory pressure: Growing RES on a process, swap-in/out, and low available memory. Consider tuning, fixing leaks, or scaling RAM.
- Steal time (st): On VPS, high st implies noisy neighbors or under provisioned host, consider migrating or upgrading.
Top vs Htop vs Other Monitoring Tools
- top: Ubiquitous, lightweight, script friendly (batch mode). Interface is spartan but powerful.
- htop: More visual UI, easier scrolling, mouse support, tree view, quick filters. Not always preinstalled.
- glances/bpytop: Rich dashboards with multiple subsystems (CPU, disk, network). Heavier dependencies.
- ps, vmstat, free, iostat, sar: Great for snapshots, historical data, and narrow diagnostics.
Learn top first for universality, then add htop for comfort and glances for dashboards.
Best Practices for Servers (From 12+ Years in Hosting)
- Set a sensible refresh: -d 1–3 to minimize overhead while keeping visibility.
- Prefer graceful actions: Try SIGTERM (15) before SIGKILL (9) to avoid data loss.
- Combine tools: Use top to spot the issue, then drill down with strace, perf, iotop, ss, or db slow logs.
- Monitor trends: Use top -b with cron during incidents to capture snapshots for postmortems.
- Harden production: Limit dangerous interactive actions to privileged users; log change windows.
- Scale before pain: If load and memory trend upward with normal traffic, plan upgrades or horizontal scaling.
Running apps on VPS or cloud? YouStable’s optimized hosting and managed servers include proactive monitoring and right sized resources, so your top output stays calm even during peak hours. When you need more CPU, RAM, or faster NVMe storage, scaling up is seamless.
Advanced Top Tips and Customization
- Persist your layout: Customize fields (f), sort key (s inside field manager), colors (z), then write settings with W (uppercase) to save to ~/.toprc.
- Wide output: On newer versions, -w adjusts width; try top -w 512 to reduce line wrapping in small terminals.
- Filter in-session: Use field manager (f) to hide noise columns; focus on PID, USER, %CPU, %MEM, RES, TIME+, COMMAND.
- Cumulative time: Toggle cumulative mode to include dead children’s CPU time; helpful for services that spawn workers (varies by build).
- Thread vs process view: Switch with -H or toggle inside top when analyzing multi threaded CPU spikes.
Common Top Command Examples (Copy/Paste)
# Start top with 2s delay, sorted by CPU
top -d 2 -o %CPU

# Focus on a single service user
top -u www-data

# Investigate a specific app by PIDs
top -p 1122,2244,5566

# Batch log 10 samples for incident review
top -b -d 3 -n 10 > /var/log/top-incident.log

# Show threads and full command lines
top -H -c
Troubleshooting Checklist Using Top
- Is load average above core count? Check which processes are on top and per-core usage (1).
- Is I/O wait high? Correlate with disk metrics and database activity.
- Is memory tight? Sort by M, look at RES and swap; confirm available memory.
- Is one service hogging CPU? Consider renice, scaling, or code level optimization.
- Do you see zombies? Fix parent process handling and review service supervision configs.
FAQs
What does the top command do in Linux?
top provides a live, updating view of running processes, CPU and memory usage, load averages, and system state. It lets you sort, filter, kill, and renice processes directly from the interface, making it a go to tool for performance monitoring and troubleshooting.
How do I sort by memory or CPU in top?
Press M to sort by memory and P to sort by CPU. You can also start top sorted by a field using -o, for example: top -o %MEM or top -o %CPU on most Linux distributions that use procps-ng.
How do I kill a process in top safely?
Inside top, press k, enter the PID, and send signal 15 (SIGTERM) first for a graceful stop. If the process won’t exit, use 9 (SIGKILL) as a last resort. On production servers, confirm the process owner and impact before killing.
What is the difference between top and htop?
top is minimal and installed by default, ideal for scripts and remote servers. htop provides a friendlier interface with color bars, mouse support, easier filtering, and process tree views. Learn top first for universality, then add htop for convenience.
Why is my load average high even when CPU isn’t 100%?
Load average includes processes waiting on CPU and I/O. High I/O wait (wa) or lock contention can increase load with moderate CPU usage. In top, check wa on the CPU line; investigate disks, databases, or network saturation accordingly.
Conclusion
The top command in Linux is a cornerstone of system monitoring. Master the header, learn the key shortcuts, and practice with realistic scenarios. If your business relies on stable, fast servers, YouStable’s optimized hosting and managed stacks help ensure your top output stays green even under heavy traffic.