Site Reliability Engineering Tools play a vital role in helping businesses maintain high availability, performance, and scalability across digital systems. As infrastructure grows more complex, SRE teams depend on these tools to automate workflows, monitor distributed environments, detect issues proactively, and ensure seamless user experiences. In a world driven by cloud computing, microservices, and continuous deployment, the right SRE tools can make the difference between smooth operations and critical downtime.
In this article, you’ll discover the 11 best Site Reliability Engineering Tools that empower organizations to achieve greater reliability and efficiency. We’ll explore their key capabilities, ideal use cases, and how each tool contributes to improved system performance, visibility, and incident management — helping your SRE team make a confident, informed choice.
What is Site Reliability Engineering?

Site Reliability Engineering (SRE) is a discipline that blends software engineering principles with IT operations to create highly reliable and scalable systems. It focuses on ensuring that applications and infrastructure run smoothly, efficiently, and with minimal downtime.
SRE practices revolve around automating operations, monitoring performance, managing incidents, and improving deployment processes. Instead of relying solely on manual intervention, SRE teams build automated systems that detect, diagnose, and resolve issues faster.
In modern cloud-native environments, SRE plays a crucial role in maintaining system health, optimizing performance, and ensuring consistent user experiences. By integrating observability, automation, and continuous improvement, Site Reliability Engineering helps organizations achieve long-term stability, scalability, and resilience in their digital services.
11 Best Site Reliability Engineering Tools (Detailed Comparison)
Selecting the right Site Reliability Engineering Tools can significantly improve how teams monitor, automate, and manage system reliability. Below is a detailed comparison of the top 11 SRE tools that empower organizations to enhance performance, uptime, and operational efficiency.
Datadog

Datadog is a comprehensive cloud-based monitoring and analytics platform built for SRE and DevOps teams. It provides unified visibility across infrastructure, applications, containers, and logs, allowing teams to quickly detect and fix performance issues. With AI-driven alerts, real-time dashboards, and extensive integrations, Datadog simplifies observability in complex cloud and hybrid environments. It’s ideal for organizations that need end-to-end monitoring and intelligent automation to maintain uptime and reliability at scale.
Key Features:
- Full-stack observability: Monitor infrastructure, applications, logs, and user experience in one unified platform.
- AI-powered alerts: Automatically detect anomalies and reduce alert fatigue with intelligent event correlation.
- Custom dashboards: Build personalized dashboards for metrics visualization and real-time tracking.
- Log management: Collect, filter, and analyze logs efficiently to accelerate incident resolution.
- Cloud-native integrations: Connect seamlessly with AWS, Azure, Google Cloud, and Kubernetes.
- Security monitoring: Detect vulnerabilities and ensure compliance through unified monitoring.
Prometheus
Prometheus is an open-source monitoring and alerting toolkit widely used in Site Reliability Engineering. Originally developed by SoundCloud, it has become a cornerstone of modern observability stacks. Prometheus is designed for collecting time-series data, making it ideal for monitoring dynamic cloud-native environments. Its pull-based metrics collection, flexible query language (PromQL), and lightweight setup make it a favorite among SRE teams. When paired with visualization tools like Grafana, it provides deep insights into application and infrastructure health.
Key Features:
- Time-series data collection: Captures real-time metrics for performance tracking and trend analysis.
- PromQL support: Offers a powerful query language for complex metric analysis and visualization.
- Alertmanager integration: Sends automated alerts to email, Slack, or PagerDuty for faster response.
- Service discovery: Automatically detects new services and endpoints in dynamic environments.
- Scalable and flexible: Works efficiently across distributed and microservices-based architectures.
- Open-source ecosystem: Supported by a strong community with frequent updates and integrations.
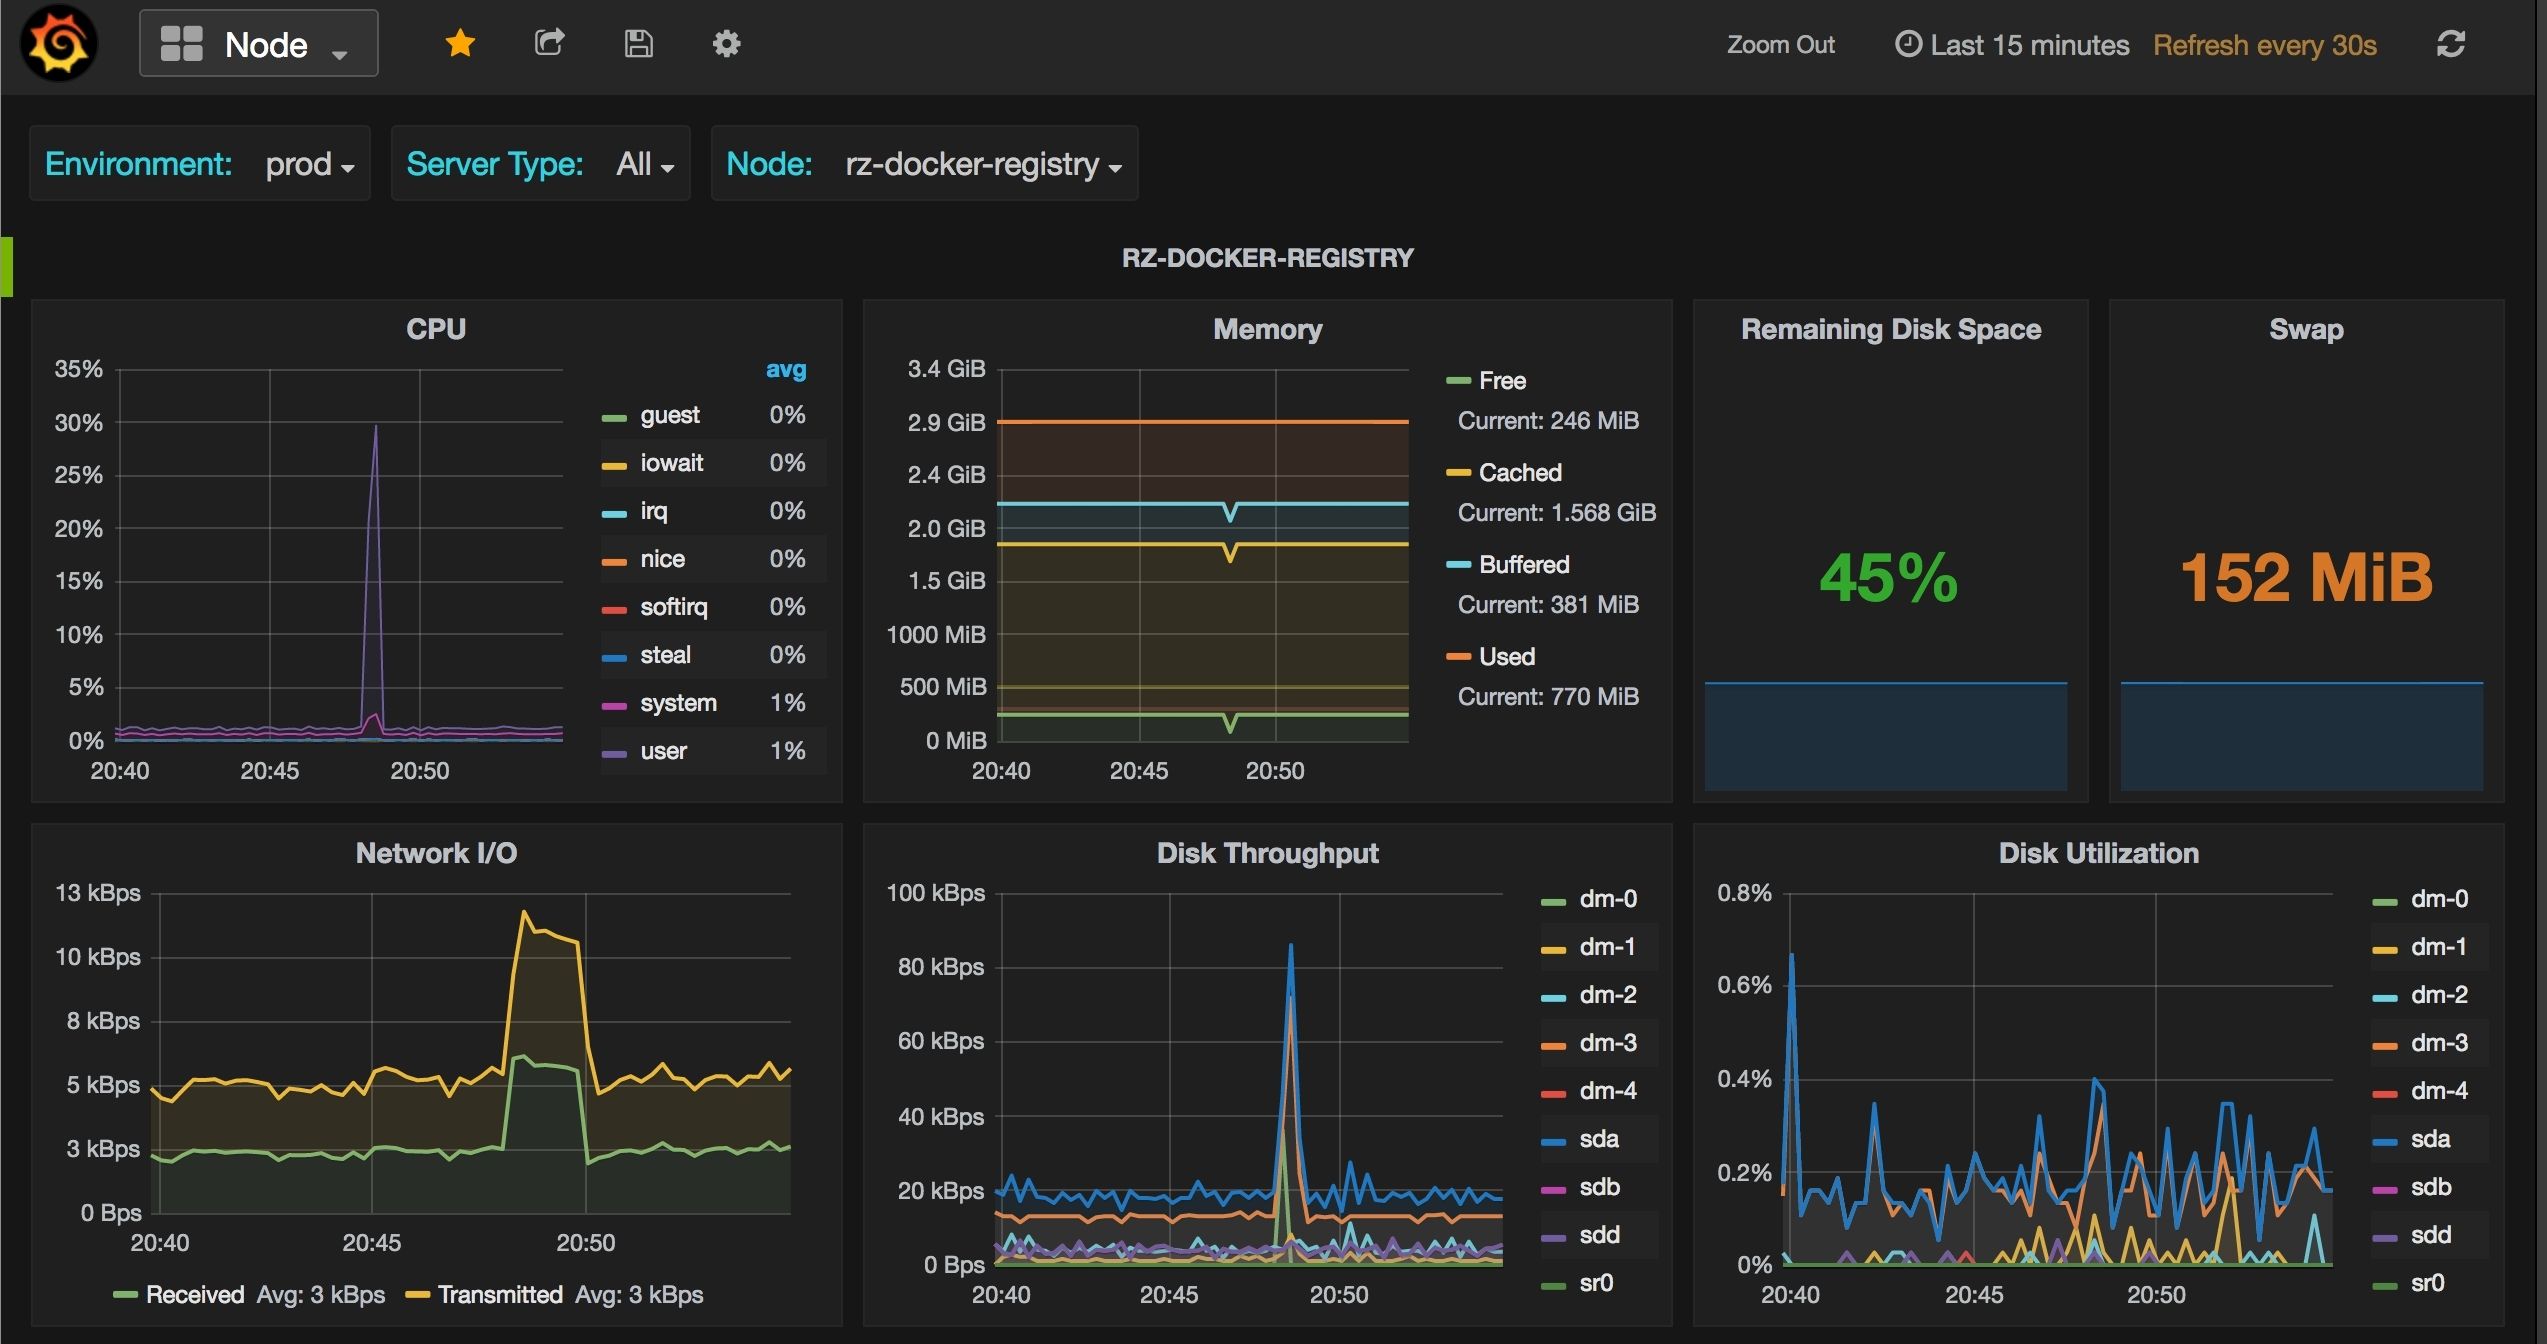
Grafana
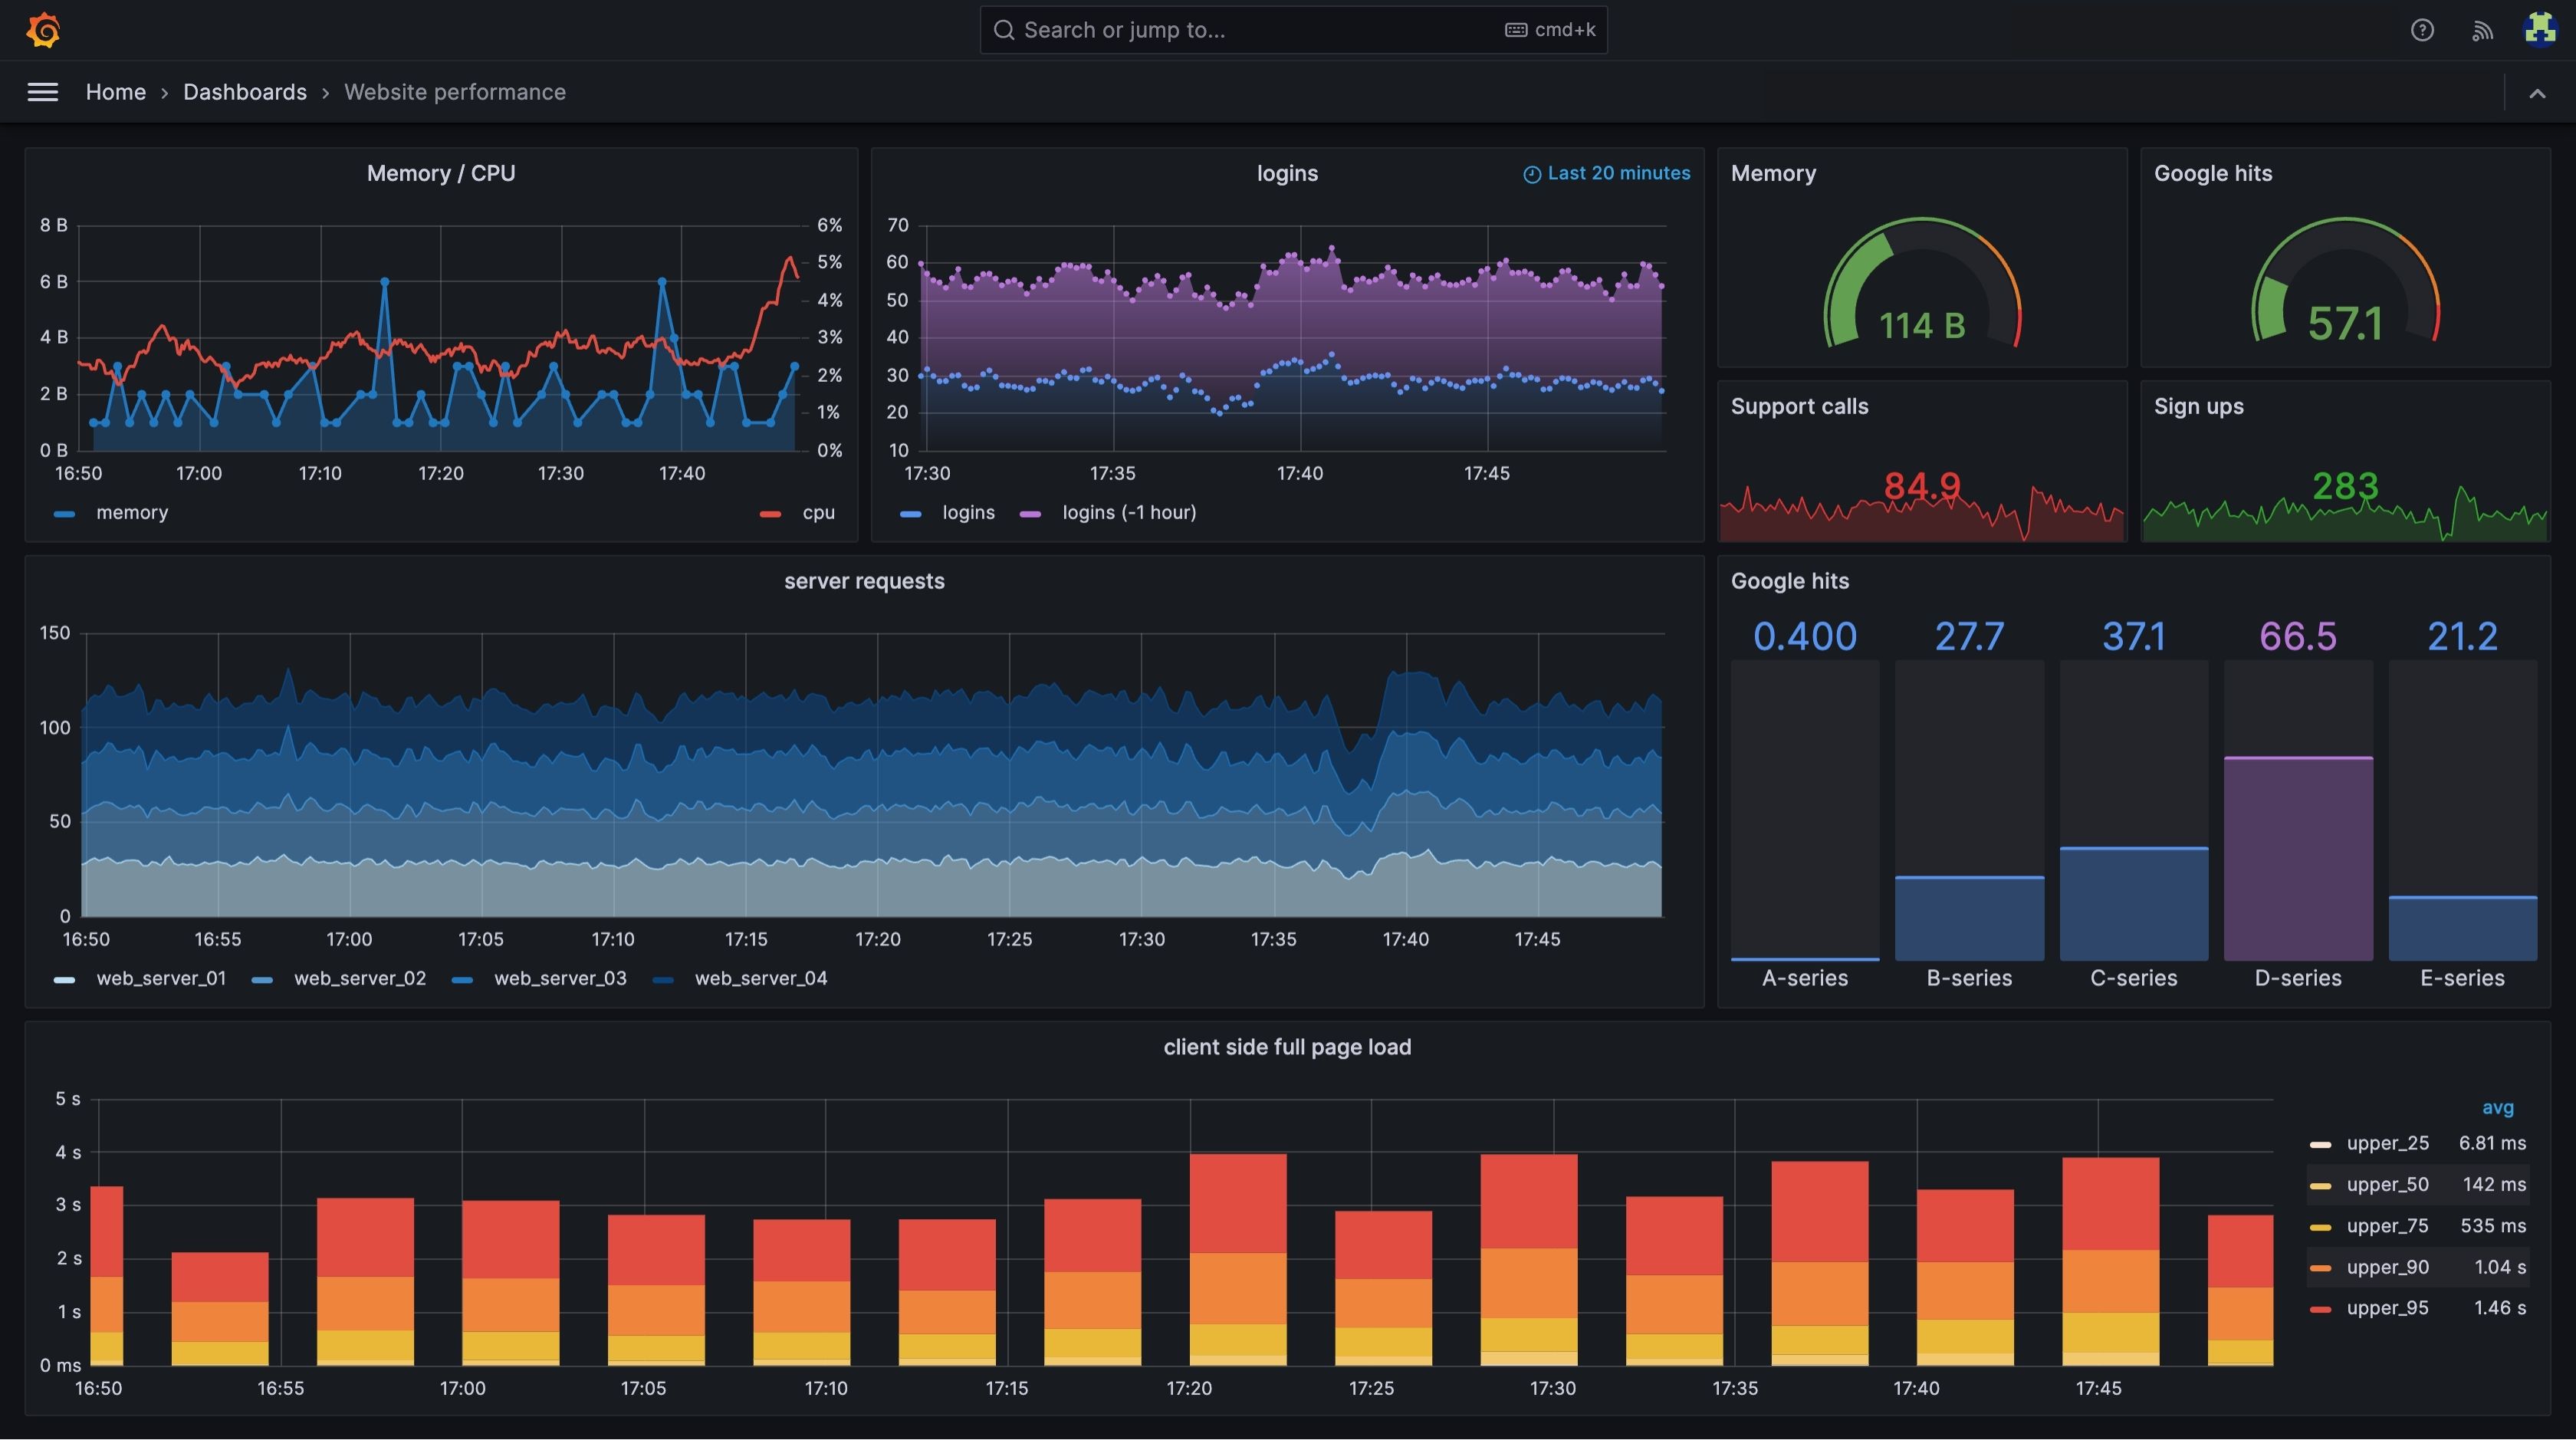
Grafana is one of the most popular visualization and analytics platforms used by SRE teams to make sense of complex data. It transforms raw metrics from multiple sources—like Prometheus, Elasticsearch, or InfluxDB—into interactive and insightful dashboards. Grafana helps teams monitor infrastructure health, detect anomalies, and make data-driven reliability decisions. Its open-source flexibility, extensive plugin ecosystem, and customizable alerts make it an essential component of modern SRE and observability stacks.
Key Features:
- Rich data visualization: Create interactive dashboards to track metrics and trends visually.
- Multi-source integration: Connects with over 100 data sources, including Prometheus, AWS, and Azure.
- Custom alerts: Configure alert rules to notify teams of anomalies in real time.
- Team collaboration: Share dashboards and insights easily across teams for better coordination.
- Extensible plugins: Extend functionality with plugins for monitoring, visualization, and automation.
- Open-source and scalable: Free to use and adaptable to enterprise-scale deployments.
Splunk
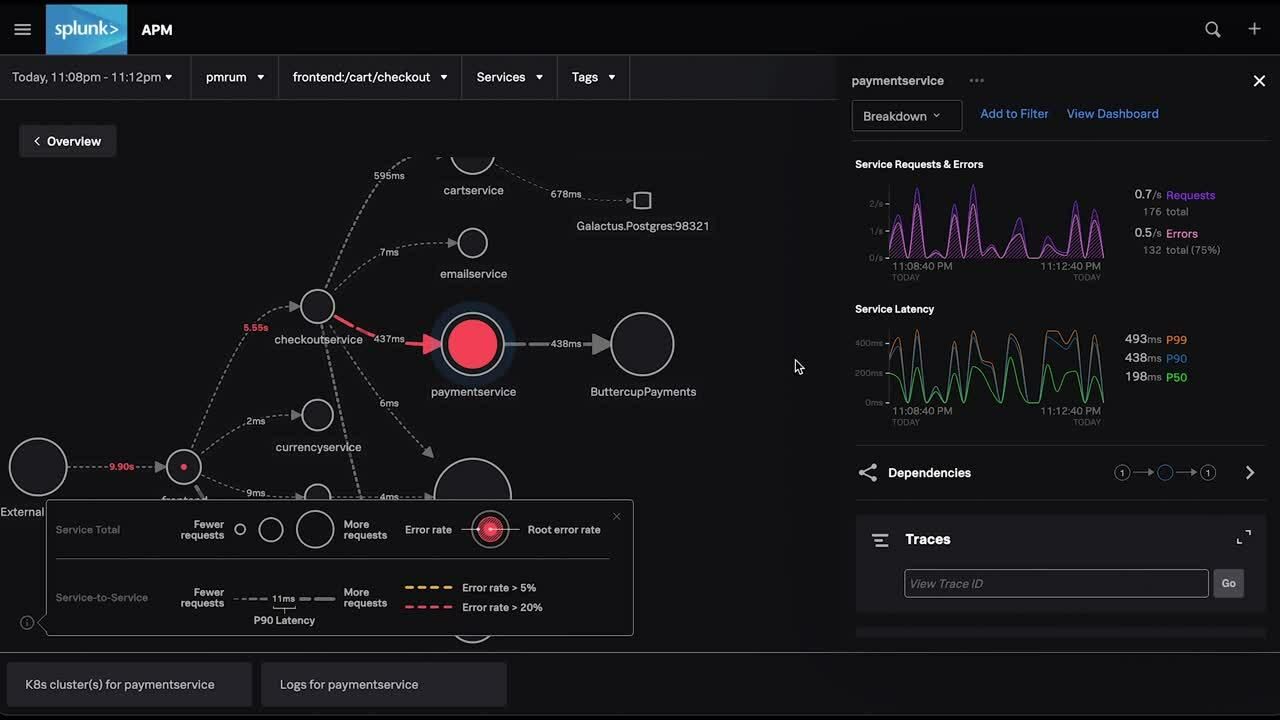
Splunk is a powerful platform designed to collect, index, and analyze machine-generated data from any source in real time. For SRE teams, Splunk provides deep observability across infrastructure, applications, and security systems, helping detect performance issues and potential risks quickly. Its advanced analytics, machine learning, and visualization tools make it ideal for large enterprises that rely on complex, distributed systems. Splunk turns massive volumes of log data into actionable insights, enabling data-driven reliability decisions.
Key Features:
- Unified observability: Gain visibility into infrastructure, logs, and metrics from a single platform.
- Machine learning analytics: Identify patterns and predict potential failures before they occur.
- Real-time monitoring: Track key performance indicators and system events continuously.
- Powerful search engine: Easily query and filter vast amounts of log data for root cause analysis.
- Custom dashboards: Build intuitive dashboards for quick visualization and decision-making.
- Enterprise-grade scalability: Handles high-volume environments with robust data processing capabilities.
New Relic
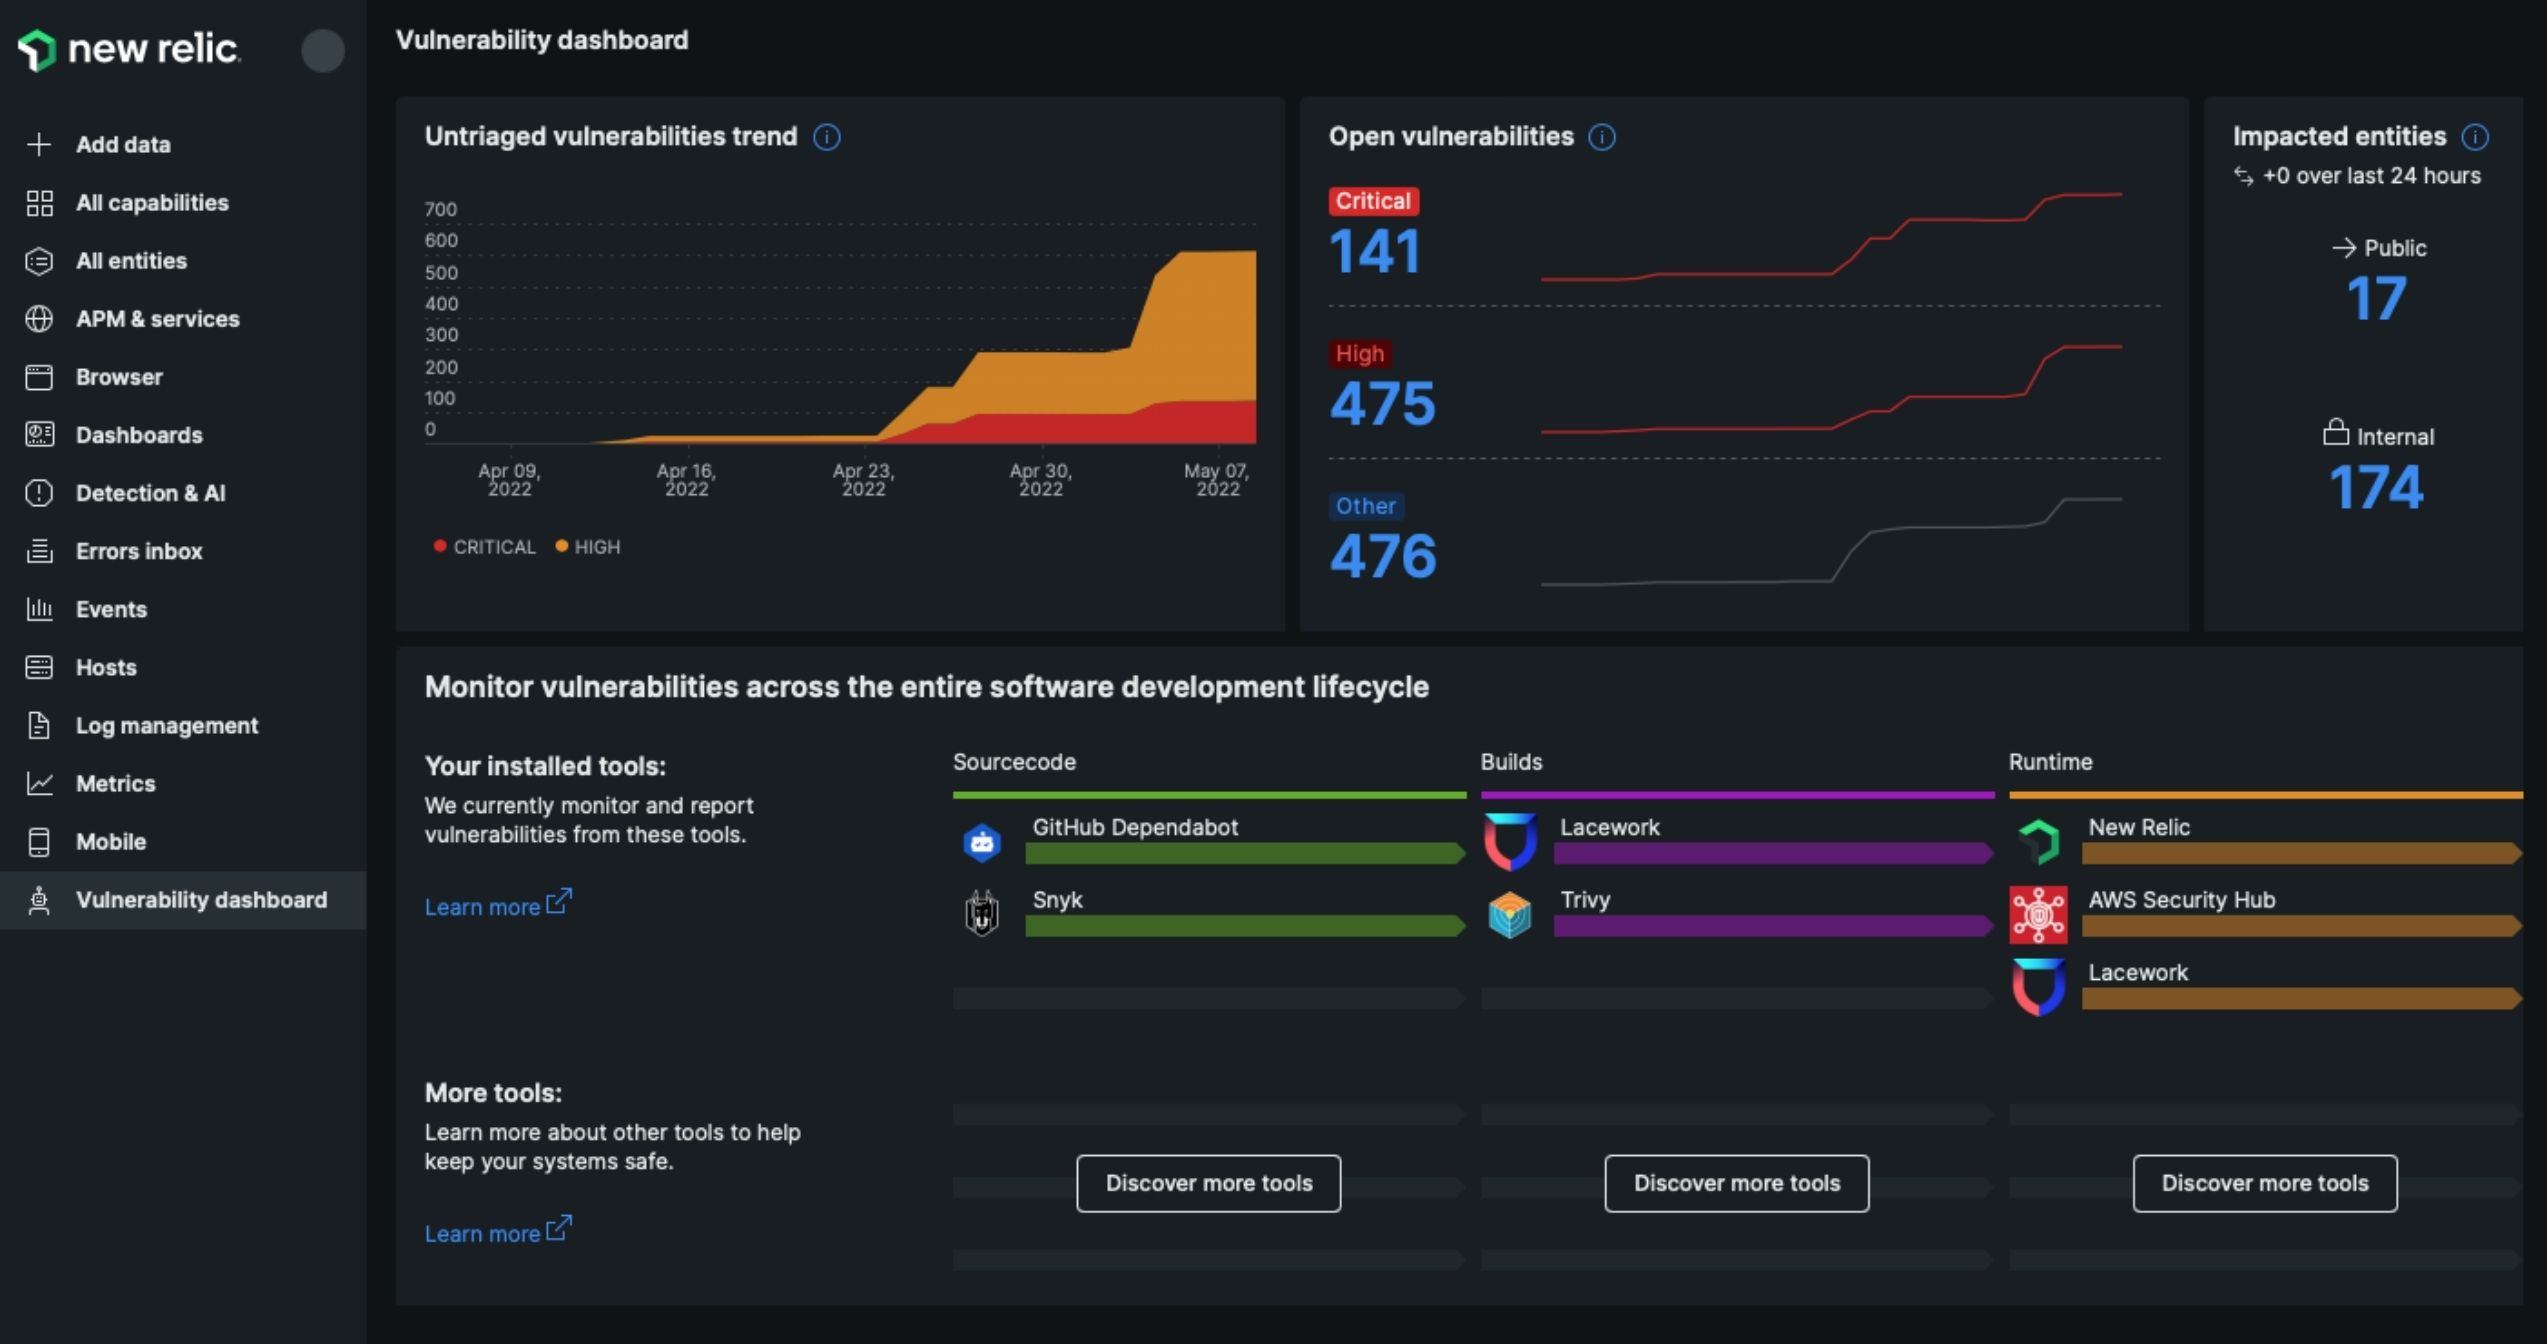
New Relic is a comprehensive observability platform that helps SRE teams monitor, debug, and optimize the performance of applications and infrastructure. It offers full-stack visibility, covering everything from frontend user experience to backend systems. With powerful telemetry data, real-time dashboards, and distributed tracing, New Relic enables faster detection and resolution of performance issues. It’s especially valuable for teams running large-scale, cloud-native applications that require continuous uptime and reliability.
Key Features:
- Full-stack observability: Track performance across applications, infrastructure, and end-user experiences.
- Distributed tracing: Identify bottlenecks and latency issues in complex, microservices-based systems.
- Real-time analytics: Analyze system performance instantly with unified telemetry data.
- AI-driven insights: Leverage anomaly detection and predictive intelligence for proactive issue management.
- Custom dashboards: Build personalized views to monitor critical SRE metrics.
- Multi-cloud integration: Seamlessly connects with AWS, GCP, and Azure environments.
PagerDuty
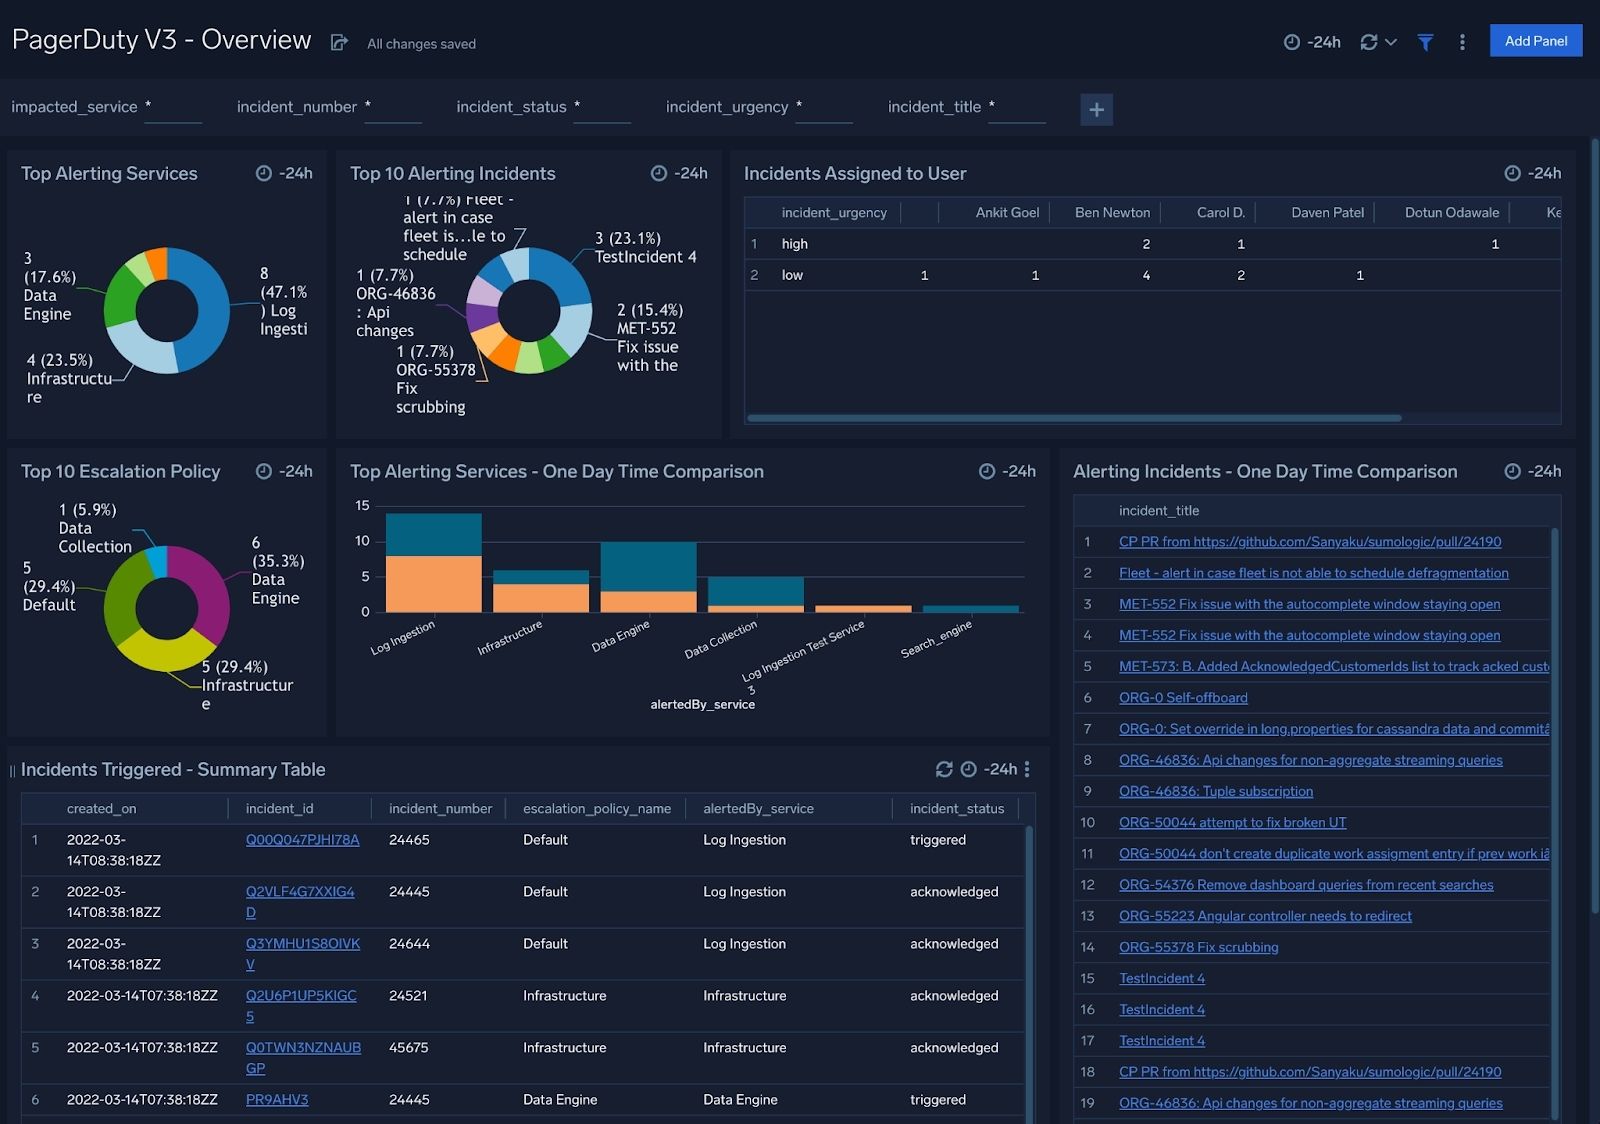
PagerDuty is a leading incident management and response platform widely used by SRE and DevOps teams. It helps organizations minimize downtime by automating incident detection, alerting, and on-call scheduling. With real-time alerts and escalation workflows, PagerDuty ensures that the right team members are notified instantly to address critical issues. Its analytics and post-incident reports also help teams improve reliability practices over time, making it an essential tool for managing system uptime and service continuity.
Key Features:
- Automated incident response: Detect and resolve issues quickly with intelligent alerting workflows.
- On-call scheduling: Simplify shift management and ensure round-the-clock coverage for critical systems.
- Real-time notifications: Deliver alerts via email, SMS, mobile app, or voice call.
- Escalation policies: Automatically route unresolved alerts to higher-level responders.
- Incident analytics: Gain insights into response patterns and improve reliability processes.
- Integration ecosystem: Works seamlessly with monitoring tools like Datadog, New Relic, and Prometheus.
Opsgenie
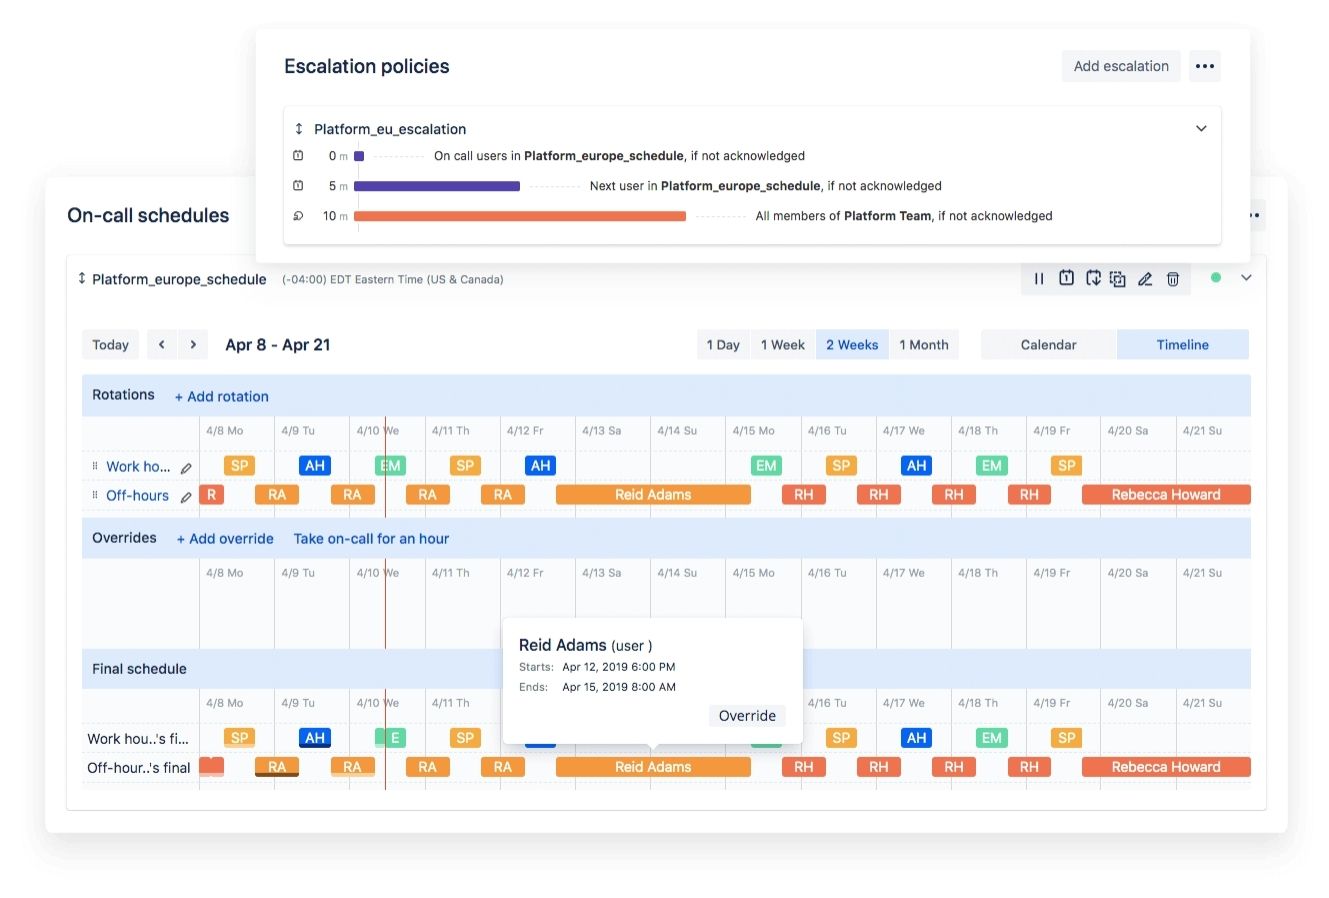
Opsgenie, a product by Atlassian, is a powerful incident management and alerting platform designed to help SRE teams respond to outages faster. It centralizes alerts from various monitoring systems and ensures they reach the right people at the right time. With advanced scheduling, escalation rules, and seamless integrations, Opsgenie reduces mean time to resolution (MTTR) and prevents alert fatigue. It’s a great fit for teams seeking a flexible, scalable, and automation-friendly solution for incident management.
Key Features:
- Centralized alerting: Aggregate alerts from multiple monitoring and logging systems.
- On-call management: Easily manage shifts, rotations, and escalation policies.
- Multi-channel notifications: Send alerts via email, SMS, voice, or mobile app.
- Incident automation: Automatically trigger workflows for faster response.
- Analytics and reports: Track performance metrics and response times for continuous improvement.
- Integrations: Works smoothly with Jira, Datadog, Grafana, and other popular observability tools.
ELK Stack (Elasticsearch, Logstash, Kibana)
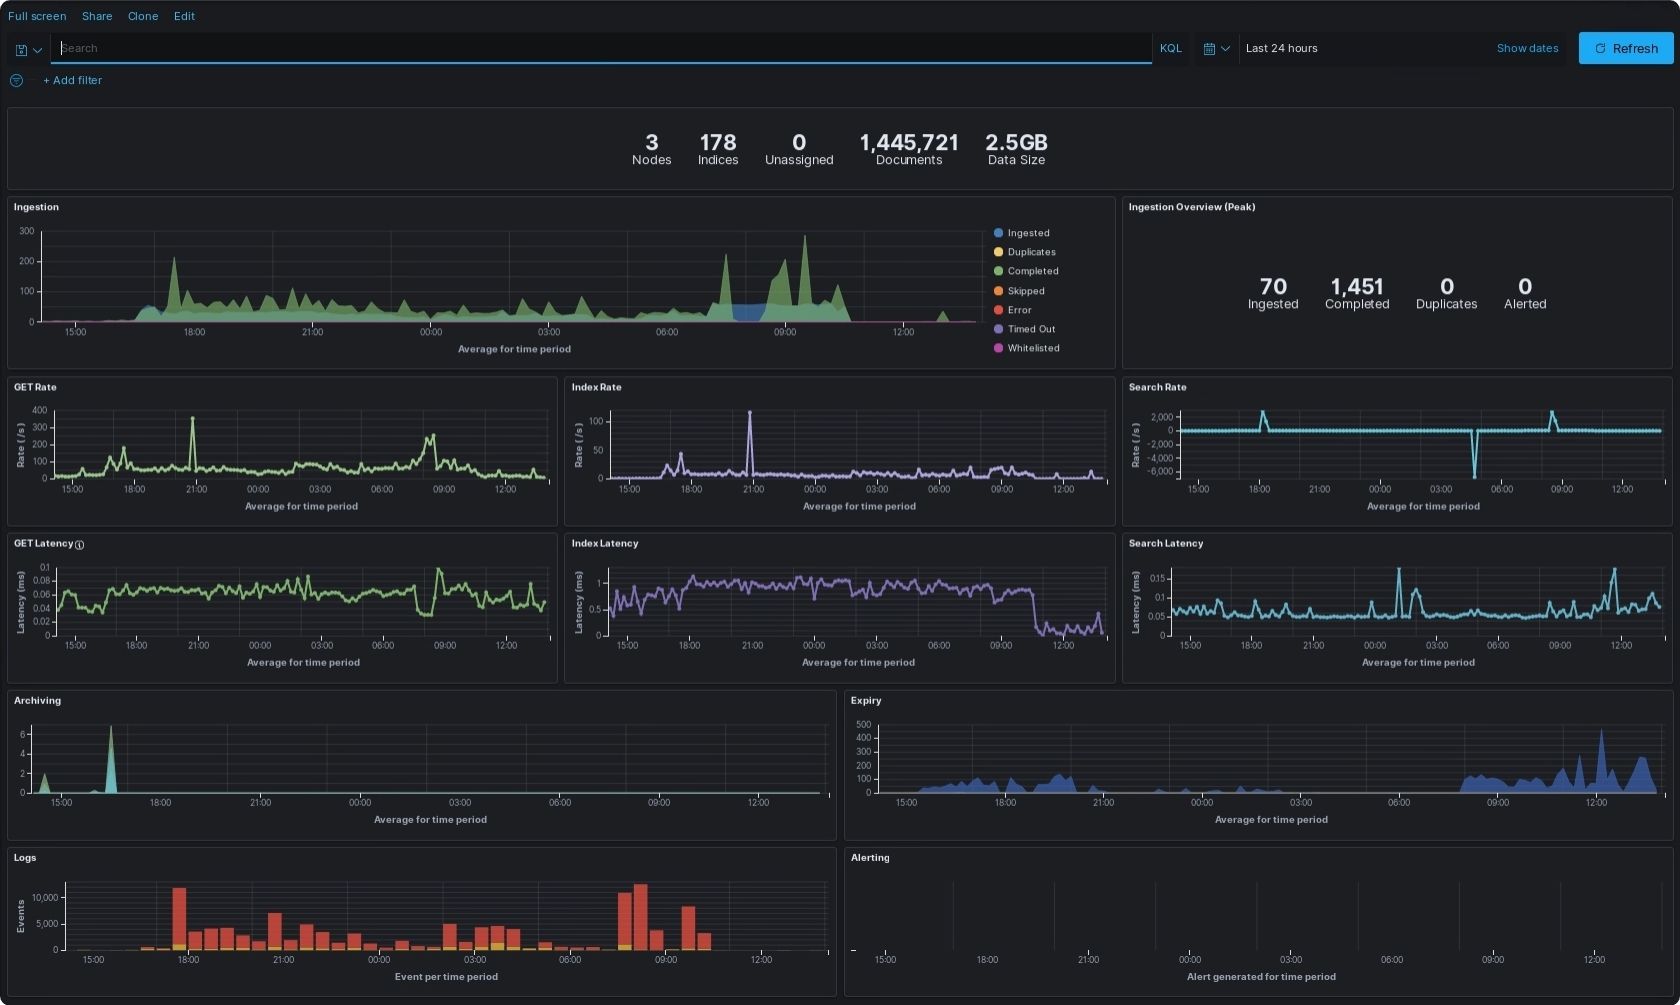
ELK Stack is a popular open-source suite used by SRE teams for log management, data visualization, and system monitoring. It combines Elasticsearch for data storage and search, Logstash for log collection and processing, and Kibana for visualization. Together, these components offer a complete solution for analyzing large volumes of operational data. SREs use ELK to monitor application performance, detect anomalies, and perform root cause analysis efficiently across distributed systems.
Key Features:
- Centralized log management: Collect and analyze logs from multiple servers and applications.
- Real-time search and analytics: Use Elasticsearch to explore large datasets instantly.
- Custom dashboards: Visualize trends and metrics in Kibana for easy monitoring.
- Flexible data pipelines: Logstash supports complex transformations and filtering workflows.
- Scalable architecture: Handles large-scale deployments with distributed indexing.
- Open-source ecosystem: Highly extensible and supported by a large community.
Kubernetes
Kubernetes is an open-source container orchestration platform that automates the deployment, scaling, and management of containerized applications. For SRE teams, Kubernetes is a foundational tool for ensuring service reliability and scalability. It helps maintain system stability through self-healing mechanisms, automatic rollouts, and intelligent workload distribution. With its strong ecosystem and declarative configuration model, Kubernetes enables efficient operations management in complex microservices and cloud-native environments.
Key Features:
- Automated orchestration: Manage containerized workloads seamlessly with built-in scheduling and scaling.
- Self-healing capabilities: Automatically restarts failed containers and replaces unhealthy nodes.
- Rolling updates: Deploy updates without downtime to maintain continuous availability.
- Service discovery: Dynamically routes traffic and load balances services efficiently.
- Declarative configuration: Define system state using YAML manifests for predictable deployments.
- Extensive ecosystem: Integrates with CI/CD, monitoring, and security tools for full-stack reliability.
Terraform
Terraform, developed by HashiCorp, is an infrastructure-as-code (IaC) tool that enables SRE teams to automate the provisioning and management of cloud resources. By defining infrastructure through declarative configuration files, Terraform ensures consistency, repeatability, and version control across environments. It supports multiple cloud providers, making it a versatile solution for hybrid and multi-cloud setups. For SRE professionals, Terraform simplifies infrastructure scaling, reduces manual errors, and enhances overall operational reliability.
Key Features:
- Infrastructure as Code (IaC): Manage infrastructure through version-controlled configuration files.
- Multi-cloud support: Provision and manage resources across AWS, Azure, and GCP from one platform.
- Automated provisioning: Deploy and update infrastructure automatically with minimal manual input.
- State management: Keep track of deployed resources and configuration changes accurately.
- Reusable modules: Standardize deployments with reusable and shareable templates.
- Integration-friendly: Works seamlessly with CI/CD pipelines and configuration management tools.
ServiceNow
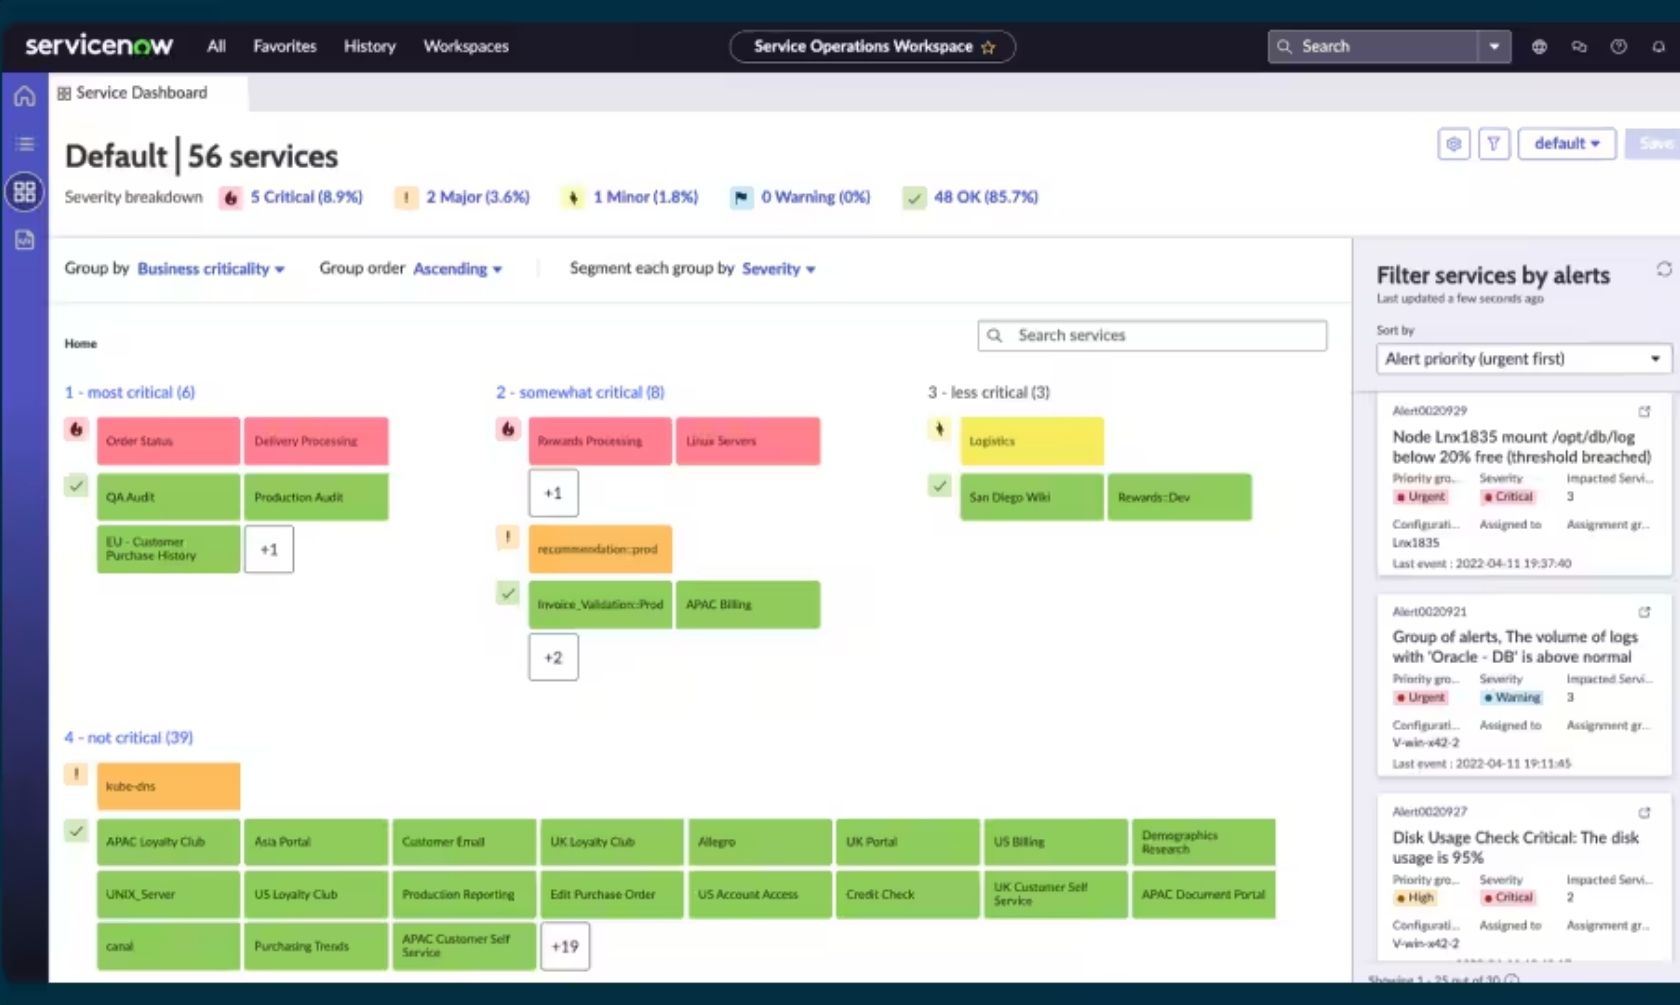
ServiceNow is a leading digital workflow and IT service management (ITSM) platform widely used by SRE teams to streamline incident, change, and problem management. It helps organizations improve operational efficiency by automating repetitive tasks and centralizing service delivery. With powerful analytics, AI-driven insights, and deep integrations, ServiceNow provides end-to-end visibility across infrastructure and operations. For SREs, it simplifies collaboration, enhances response times, and ensures consistent service reliability across the enterprise.
Key Features:
- Incident and problem management: Track, prioritize, and resolve incidents efficiently.
- Automated workflows: Streamline repetitive tasks and reduce manual intervention.
- Performance analytics: Gain actionable insights into service uptime and reliability metrics.
- Change management: Manage infrastructure updates with reduced risk of service disruption.
- AI-powered insights: Use machine learning to detect issues and recommend proactive actions.
- Integration ecosystem: Connect seamlessly with monitoring tools and cloud environments.
How to Choose the Right Site Reliability Engineering Tool
Selecting the right Site Reliability Engineering Tool depends on your organization’s infrastructure, scalability needs, and workflow automation goals. The right choice ensures better visibility, faster response times, and improved uptime. Here are key factors to consider when making your decision:
- Scalability: Choose a tool that can handle increasing workloads and scale seamlessly with your infrastructure growth.
- Integration support: Ensure compatibility with your existing systems, CI/CD pipelines, and observability tools.
- Automation capabilities: Look for solutions that automate monitoring, alerting, and incident response tasks.
- Real-time monitoring: The tool should provide instant visibility into metrics, logs, and system performance.
- Alert management: Opt for platforms with smart alerting to reduce noise and prioritize critical issues.
- Cost efficiency: Evaluate total ownership costs, including setup, integrations, and ongoing maintenance.
- Ease of use: A user-friendly interface and intuitive dashboards help SRE teams respond faster and more effectively.
Benefits of Using Site Reliability Engineering Tools
Implementing Site Reliability Engineering Tools helps organizations achieve operational excellence by improving system performance, resilience, and uptime. These tools enable teams to shift from reactive problem-solving to proactive management, reducing the risk of costly downtime.
One of the biggest advantages is increased visibility — SRE teams can monitor applications, infrastructure, and services in real time. This ensures that potential issues are detected early before they impact users.
Another key benefit is automation. By automating routine tasks like scaling, alerting, and incident responses, teams save time and reduce human error.
These tools also foster better collaboration between development and operations teams, aligning goals and improving communication. Finally, they deliver long-term ROI by optimizing resource usage, enhancing reliability, and ensuring consistent service delivery across digital environments.
Conclusion
Site Reliability Engineering Tools are essential for modern organizations striving to maintain consistent uptime, scalability, and superior user experiences. From monitoring and visualization to automation and incident response, these tools empower teams to manage complex infrastructures with confidence.
The right combination of tools — whether it’s Datadog for observability, Prometheus for monitoring, or PagerDuty for alerting — helps build a robust reliability framework. Each tool brings unique strengths, allowing teams to detect issues faster, streamline workflows, and maintain service continuity.
By adopting the best Site Reliability Engineering Tools suited to your environment, you can enhance performance, reduce downtime, and drive continuous improvement in your operational strategy.