The 10 best free tools to monitor server uptime in 2026 include UptimeRobot, Better Stack, HetrixTools, Uptime Kuma, Upptime, Zabbix, PRTG Free, Prometheus with Blackbox Exporter, Nagios Core, and LibreNMS. These options cover cloud SaaS and open source self hosted monitoring with HTTP, ping, and port checks, alerting, status pages, and SLA reporting.
Keeping servers available 24/7 isn’t optional it’s the backbone of user trust, SEO, and revenue. In this guide, I’ll walk you through the best free tools to monitor server uptime in 2026, what they’re good at, how to choose the right one for your stack, and how to deploy them correctly to avoid noisy alerts.
What is Server Uptime Monitoring?
Server uptime monitoring continuously checks your website, API, or service endpoints from one or more locations to confirm they’re reachable and responsive.
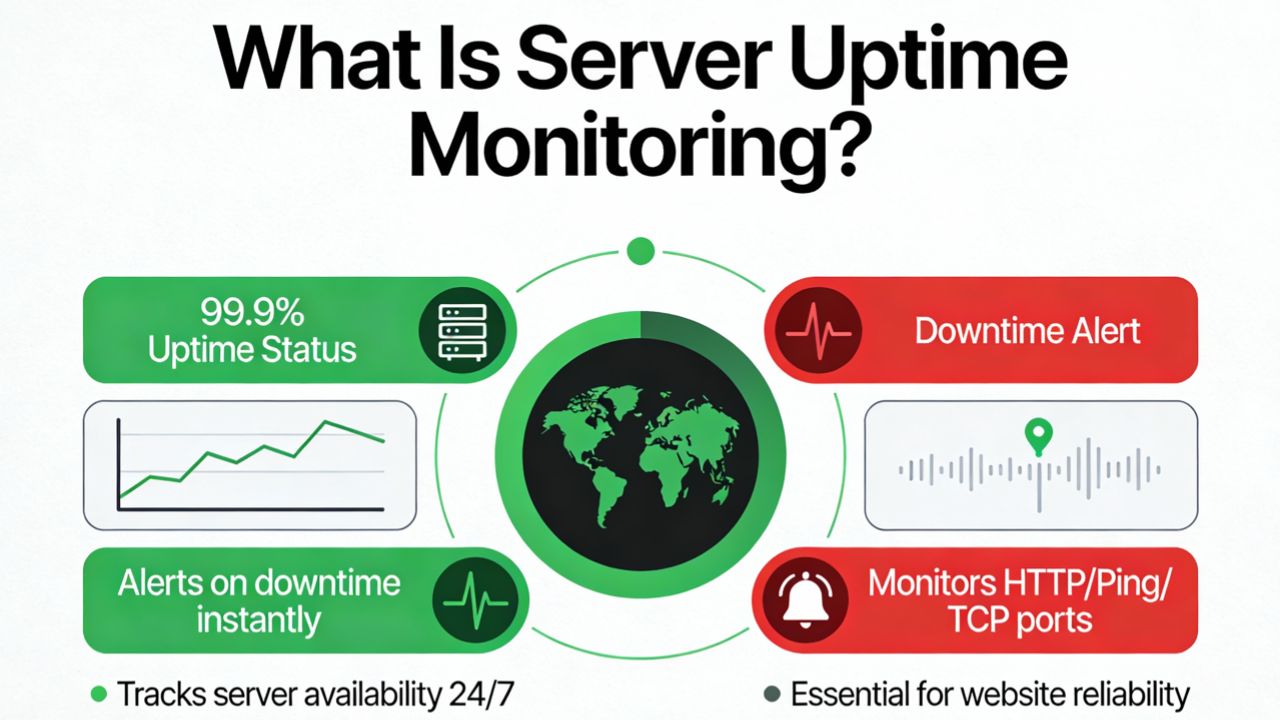
Typical probes include HTTP(S) requests, ICMP ping, TCP port checks (e.g., 22, 25, 443), and custom scripts. When something fails, the tool alerts you by email, SMS, Slack, or webhook so you can respond fast.
How to Choose the Right Free Uptime Monitor in 2026
Before picking a platform, clarify the must haves for your team and workload. The best free tools to monitor server uptime cover these core needs:
- Check types: HTTP(S), ping, port (TCP), DNS, SSL expiry, cron/heartbeat
- Frequency and limits: Minimum check interval (1-5 minutes), number of monitors
- Alerting: Email, SMS/phone, Slack/Teams, PagerDuty, webhooks
- Multi-location verification: Reduces false positives
- Reports: Uptime percentages, SLA reports, incident timelines
- Status pages: Public or private status pages for stakeholders
- Integrations and APIs: CI/CD hooks, Terraform, custom automations
- Hosting model: Cloud SaaS (zero maintenance) vs. self hosted (full control)
Tip from the trenches: start with one simple HTTP and one TCP port check per service, add a 60-120 second grace window to avoid alert storms during brief deploys, and verify alerts through multiple channels (e.g., email + Slack).
10 Best Free Tools to Monitor Server Uptime in 2026
1) UptimeRobot (SaaS)
UptimeRobot remains a go to free uptime monitoring service with quick setup and reliable alerts. The free tier typically offers multiple monitors with 5 minute checks, HTTP(s)/ping/port checks, and basic alerting.
- Best for: Small sites, blogs, landing pages, simple APIs
- Highlights: Easy onboarding, multi channel alerts, SSL expiry checks
- Considerations: Free plan check interval and features are limited vs. paid
Why it’s solid: If you want dependable HTTP and ping monitoring without maintenance, UptimeRobot is hard to beat for a free starter.
2) Better Stack (Better Uptime) – SaaS
Better Stack combines uptime checks, incident management, on call, and status pages with a generous free plan. It’s polished, integrates with Slack, and provides incident timelines that help postmortems.
- Best for: Startups, product teams, and SREs wanting incident workflows
- Highlights: On call schedules, runbooks, screenshots on failure
- Considerations: Free tier limits monitors/check frequency and some incident features
Why it’s solid: It bridges simple uptime monitoring with lightweight incident response in one place.
3) HetrixTools (SaaS)
HetrixTools offers free uptime monitoring focused on performance and practicality. Expect HTTP, ping, and port checks, SSL tracking, and alerting with clean reports.
- Best for: SMBs and agencies managing many small sites
- Highlights: Straightforward UI, blacklist checks, public status pages
- Considerations: Advanced analytics and faster intervals are paid
Why it’s solid: Low friction monitoring with useful extras like SSL and reputation/blacklist checks.
4) Uptime Kuma (Self hosted, Open Source)
Uptime Kuma is a beloved open source alternative to SaaS uptime tools. It’s easy to deploy via Docker, supports HTTP, ping, DNS, ports, and has a slick dashboard with status pages and notifications.
- Best for: DevOps teams wanting control without steep complexity
- Highlights: Many notification channels, status pages, multi probe support
- Considerations: You manage hosting, backups, and scaling
Why it’s solid: The fastest path to a free, modern, self hosted uptime platform.
5) Upptime (Self hosted on GitHub)
Upptime uses GitHub Actions to run checks and GitHub Pages to publish a status site. No servers to manage and no monthly bill if your usage fits free GitHub quotas.
- Best for: Developers and OSS projects
- Highlights: Git based history, automatic status site, issues for incidents
- Considerations: Check frequency depends on scheduled workflows; not real time
Why it’s solid: Clever use of GitHub’s free tier to deliver durable monitoring and public transparency.
6) Zabbix (Self hosted, Open Source)
Zabbix is an enterprise grade monitoring platform covering servers, networks, and applications with powerful alerting and visualization. It excels for hybrid environments at scale.
- Best for: Enterprises and MSPs needing deep, centralized monitoring
- Highlights: Auto discovery, templating, flexible alert rules, maps, proxy nodes
- Considerations: Steeper learning curve; requires infrastructure and tuning
Why it’s solid: One of the most capable free platforms when you need more than simple uptime checks.
7) PRTG Free (Paessler) – Self hosted
PRTG Free offers up to 100 sensors at no cost, enough to monitor multiple servers and services. It supports ping, HTTP, SNMP, WMI, and more, ideal for Windows heavy shops.
- Best for: Windows admins and mixed on prem environments
- Highlights: Visual maps, auto discovery, rich sensor library
- Considerations: 100 sensor cap; Windows first mindset; on prem maintenance
Why it’s solid: Generous free tier for real infrastructure visibility beyond uptime.
8) Prometheus + Blackbox Exporter (Self hosted, Open Source)
Prometheus is the de facto monitoring standard for cloud native stacks. Pair it with Blackbox Exporter to probe HTTP, HTTPS, DNS, TCP, and ICMP, and Grafana for dashboards.
- Best for: Kubernetes, microservices, and SRE workflows
- Highlights: Powerful querying (PromQL), labels, service discovery, alertmanager
- Considerations: DIY setup; requires alert routing and storage planning
Why it’s solid: Industrial grade, fully free, and highly extensible for modern stacks.
9) Nagios Core (Self hosted, Open Source)
Nagios Core is a classic. With a vast plugin ecosystem, it handles ping, HTTP, service checks, and custom scripts. It’s stable and battle tested for uptime monitoring.
- Best for: Traditional sysadmin teams and legacy environments
- Highlights: Massive plugin library, granular alerting, proven track record
- Considerations: Manual config; UI feels dated; scaling requires care
Why it’s solid: If you value simplicity and control, Nagios Core gets the job done without licensing costs.
10) LibreNMS (Self hosted, Open Source)
LibreNMS is a community driven network monitoring system supporting auto discovery, alerting, and metrics across routers, switches, and servers. Use it for availability and performance in mixed networks.
- Best for: Network centric teams wanting free NMS with uptime
- Highlights: Auto discovery, alerting, dashboards, wide device support
- Considerations: Focuses on network SNMP; web checks are simpler than SaaS tools
Why it’s solid: Strong choice when network health and server uptime both matter.
Quick Start Examples (Free and Practical)
Add a basic HTTP uptime check with curl (Linux)
# Returns non-zero exit if HTTP code != 200
if [ "$(curl -s -o /dev/null -w "%{http_code}" https://example.com/health)" -ne 200 ]; then
  echo "Example.com is down!" | mail -s "Uptime Alert" ops@example.com
fi
Schedule checks every 5 minutes with cron
*/5 * * * * /usr/local/bin/check_example.sh >/dev/null 2>&1Run Uptime Kuma with Docker Compose
version: "3"
services:
  uptime-kuma:
    image: louislam/uptime-kuma:latest
    container_name: uptime-kuma
    volumes:
      - ./data:/app/data
    ports:
      - "3001:3001"
    restart: always
These quick wins give you immediate visibility. For production grade alerting and reports, complement them with one of the free tools above.
Best Practices That Reduce False Alerts
- Use multiple locations: Confirm a failure from at least two regions.
- Add grace periods: Wait 60-120 seconds before alerting during deploys.
- Probe the right thing: Use a lightweight health endpoint that checks dependencies.
- Alert to the right channel: Email for summaries, Slack/PagerDuty for criticals.
- Measure latency and SSL: Track performance and certificate expiry to prevent avoidable downtime.
- Keep contacts fresh: Rotate on call and test notifications monthly.
When to Upgrade from Free to Paid
- You need 30-60s checks or more monitors than the free limit.
- Global multi location confirmations and advanced alert routing are required.
- Regulated SLAs demand detailed reporting and audit trails.
- You want SMS/voice escalation, on call schedules, and incident workflows.
- You need synthetic transactions (multi step user journeys) instead of basic pings.
Free plans are excellent to start. As your business and compliance needs grow, consider upgrading to unlock higher frequency checks, richer alerting, and better reporting.
Feature by Feature Comparison (What Matters Most)
- Fastest setup: UptimeRobot, Better Stack, HetrixTools (SaaS)
- Most control, minimal ops: Uptime Kuma (self hosted, easy), Upptime (GitHub based)
- Enterprise depth: Zabbix, Prometheus+Blackbox, Nagios Core, LibreNMS
- Windows friendly: PRTG Free
- Status pages on free tier: Uptime Kuma, Upptime; limited/basic on some SaaS
- Best for APIs: Better Stack, UptimeRobot, Prometheus+Blackbox with HTTP probes
Note: Plan limits change. Always check the provider’s current free tier terms in 2026 for monitor counts, frequency, and alert quotas.
FAQs
What’s a good server uptime target?
99.9% (three nines) is a practical baseline for many businesses. Mission critical apps aim for 99.95%-99.99%. Each extra “nine” gets exponentially harder and costlier, so align targets with your risk tolerance and budget.
Are free uptime monitors reliable enough for production?
Yes, for basic availability checks and small to mid sites. The trade offs are longer check intervals, fewer monitors, and limited alerting. For strict SLAs, add multi location verification and consider paid tiers for faster checks and reports.
Do I need HTTP checks if I already ping the server?
Yes. Ping (ICMP) only confirms network reachability, not application health. Use HTTP to verify your web app, TCP to verify ports (e.g., 443, 3306), and optionally a /health endpoint that tests critical dependencies (DB, cache, storage).
How often should uptime checks run?
Every 1-5 minutes is typical. Free plans often start at 5 minutes. Balance granularity with alert fatigue—pair a modest interval (e.g., 3 minutes) with multi location confirmation and a short grace period to avoid false positives.
Can I get SMS or phone alerts for free?
Some free tiers include limited SMS credits, but many restrict SMS/phone to paid plans. Email, Slack, and webhooks are commonly free. You can roll your own SMS via a webhook + a free tier of an SMS gateway, if available.
Which open source uptime monitor is easiest to start with?
Uptime Kuma is the easiest to deploy and use, especially with Docker. For deeper observability in cloud native stacks, Prometheus with Blackbox Exporter is incredibly powerful, but requires more setup.
What should I monitor besides uptime?
Monitor latency, SSL certificate expiry, DNS, CPU/memory/disk, error rates, and dependencies like databases and third party APIs. Correlating uptime with these signals helps you fix the root cause faster.
Conclusion
The best free tools to monitor server uptime in 2026 combine speed, clarity, and control. Start simple with a SaaS like UptimeRobot or Better Stack, or self host Uptime Kuma for full control. As your footprint grows, layer in Prometheus or Zabbix and upgrade for tighter SLAs. If you need help choosing or deploying, YouStable’s experts are here to guide you.